Interpret population-genomic results
Source:vignettes/interpreting-results.Rmd
interpreting-results.RmdPopulation-genomic outputs are summaries of a particular sample, marker set, filtering policy, population definition, and model. They are not direct measurements of demographic history or causation. Interpretation should begin with execution and validation evidence, not with the most visually striking figure.
Read results in this order
- Confirm exact sample identity and metadata alignment.
- Review sample and variant QC, missingness, allele-frequency filters, and LD pruning.
- Confirm module capability, execution state, and validation state.
- Inspect numerical source tables before figures.
- Compare related analyses and investigate disagreement.
- State assumptions, uncertainty, exclusions, and alternative explanations.
Execution and evidence states
Start with analysis_execution_ledger.tsv,
analysis_validation.tsv, and the report’s own “Pipeline
notices” section (every WARNING/INFO message
recorded during the run, in one place; present only when there is at
least one to show).
| State | Meaning | Interpretation rule |
|---|---|---|
success |
The module completed | Interpret only after its validation record passes |
skipped or unavailable |
Required metadata, software, or inputs were absent | Report the reason; do not infer a negative biological result |
blocked |
A prerequisite failed or did not complete | Interpret neither the blocked module nor missing downstream artifacts |
failed |
The module encountered an error or invalid output | Resolve the cause and rerun before scientific use |
timed_out |
The configured elapsed-time budget was exceeded | Treat as incomplete, not as evidence for absence |
| diagnostic-only | A comparison is informative but not release-gating | Do not describe it as certified equivalence |
| insufficient evidence | Required datasets, repetitions, approvals, or comparisons are missing | Do not convert the state into pass or fail |
Quality control and filtering
Sample and variant QC determine the data on which every downstream result depends.
Review missingness, heterozygosity, minor-allele frequency, retained sample counts, retained variant counts, chromosome representation, and the exact LD-pruned SNP list. Large changes after one threshold deserve explanation. A sample with unusual heterozygosity may reflect biology, contamination, ploidy mismatch, mapping error, or sample mixture; the statistic alone does not identify the cause.
Filtering can change ordinations, distances, diversity, and differentiation. Report thresholds and sensitivity analyses when conclusions depend on a narrow filtering choice.
00_vcf_variant_types.tsv is the very first table
written, before any QC threshold: a bcftools stats-based
transparency count of the raw input VCF’s record types, showing how many
are the biallelic, polymorphic SNPs this pipeline analyzes versus
indels, multiallelic sites, MNPs, or other variant types
SNPRelate::snpgdsVCF2GDS(method = "biallelic.only")
silently drops during VCF-to-GDS conversion. A raw VCF straight off a
variant caller does not need pre-filtering – this table exists so you
can see that filtering happened, not just trust that it did. Any run
with at least one dropped record also logs a summary line and adds an
INFO entry to the report’s own “Pipeline notices”
section.
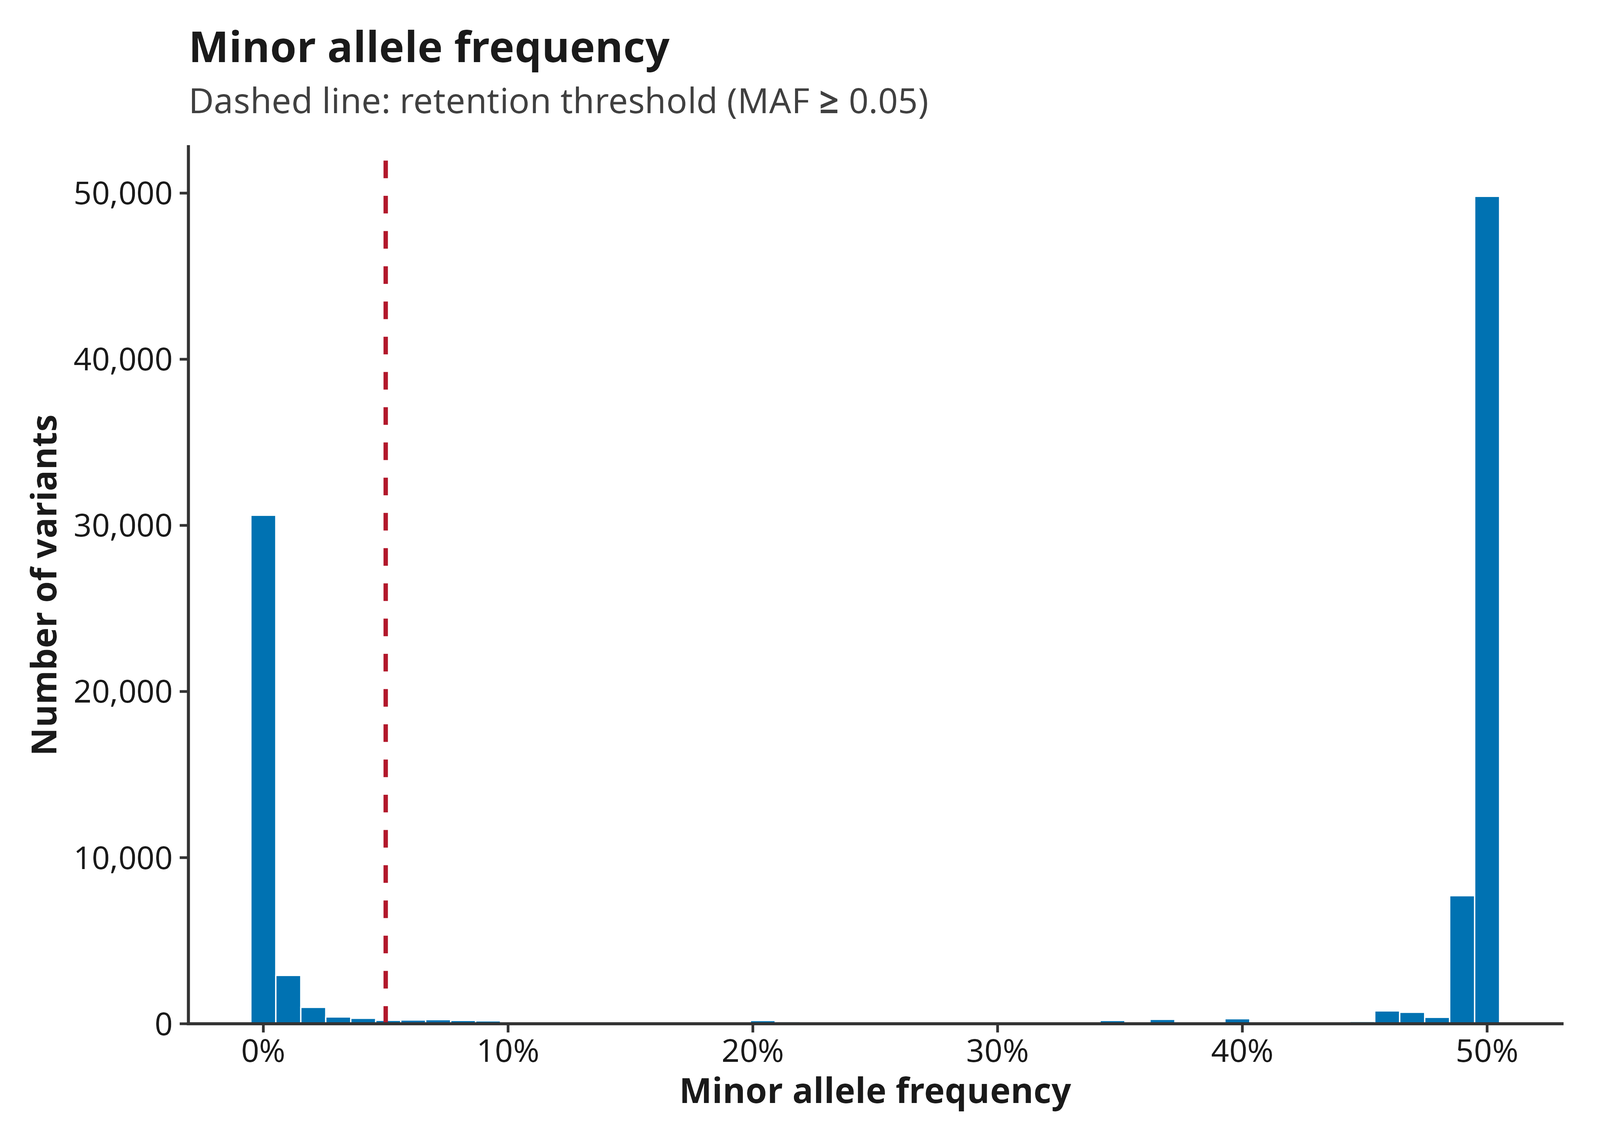
The quickstart example (see vignette("quickstart"))
starts from 98,922 biallelic SNPs (21,418 on chromosome 22, 16,999 on
chromosome X, 60,505 on chromosome Y – real, male-only 1000 Genomes
data; the 83 female samples correctly show no calls there at all, not a
data-quality problem); MAF filtering retains 63,585 of these combined.
By default (qc.autosome_only) only the 1,969 chromosome 22
SNPs continue into LD pruning, which reduces them to 357 – the marker
set used by PCA, IBS, kinship, DAPC, the ancestry backends, ROH, FST,
genome scans, diversity, and AMOVA. Sex chromosomes are excluded from
these by default because they are not uniformly diploid (or, for
chromosome Y, present at all) across samples; mixing them in measurably
corrupted results on this exact dataset before these exclusions were
added: kinship for a known real duplicate pair collapsed from 0.4525 to
essentially zero, and separately every female sample was silently
dropped from the entire pipeline (chromosome Y’s near-total absence in
females inflated their overall missingness past the sample-QC
threshold). The remaining 1,148 QC-passing chromosome X SNPs and 60,468
QC-passing chromosome Y SNPs are reserved for the sex-check module
below. Real numbers from a real 160-sample, 8-population run, not a toy
fixture.
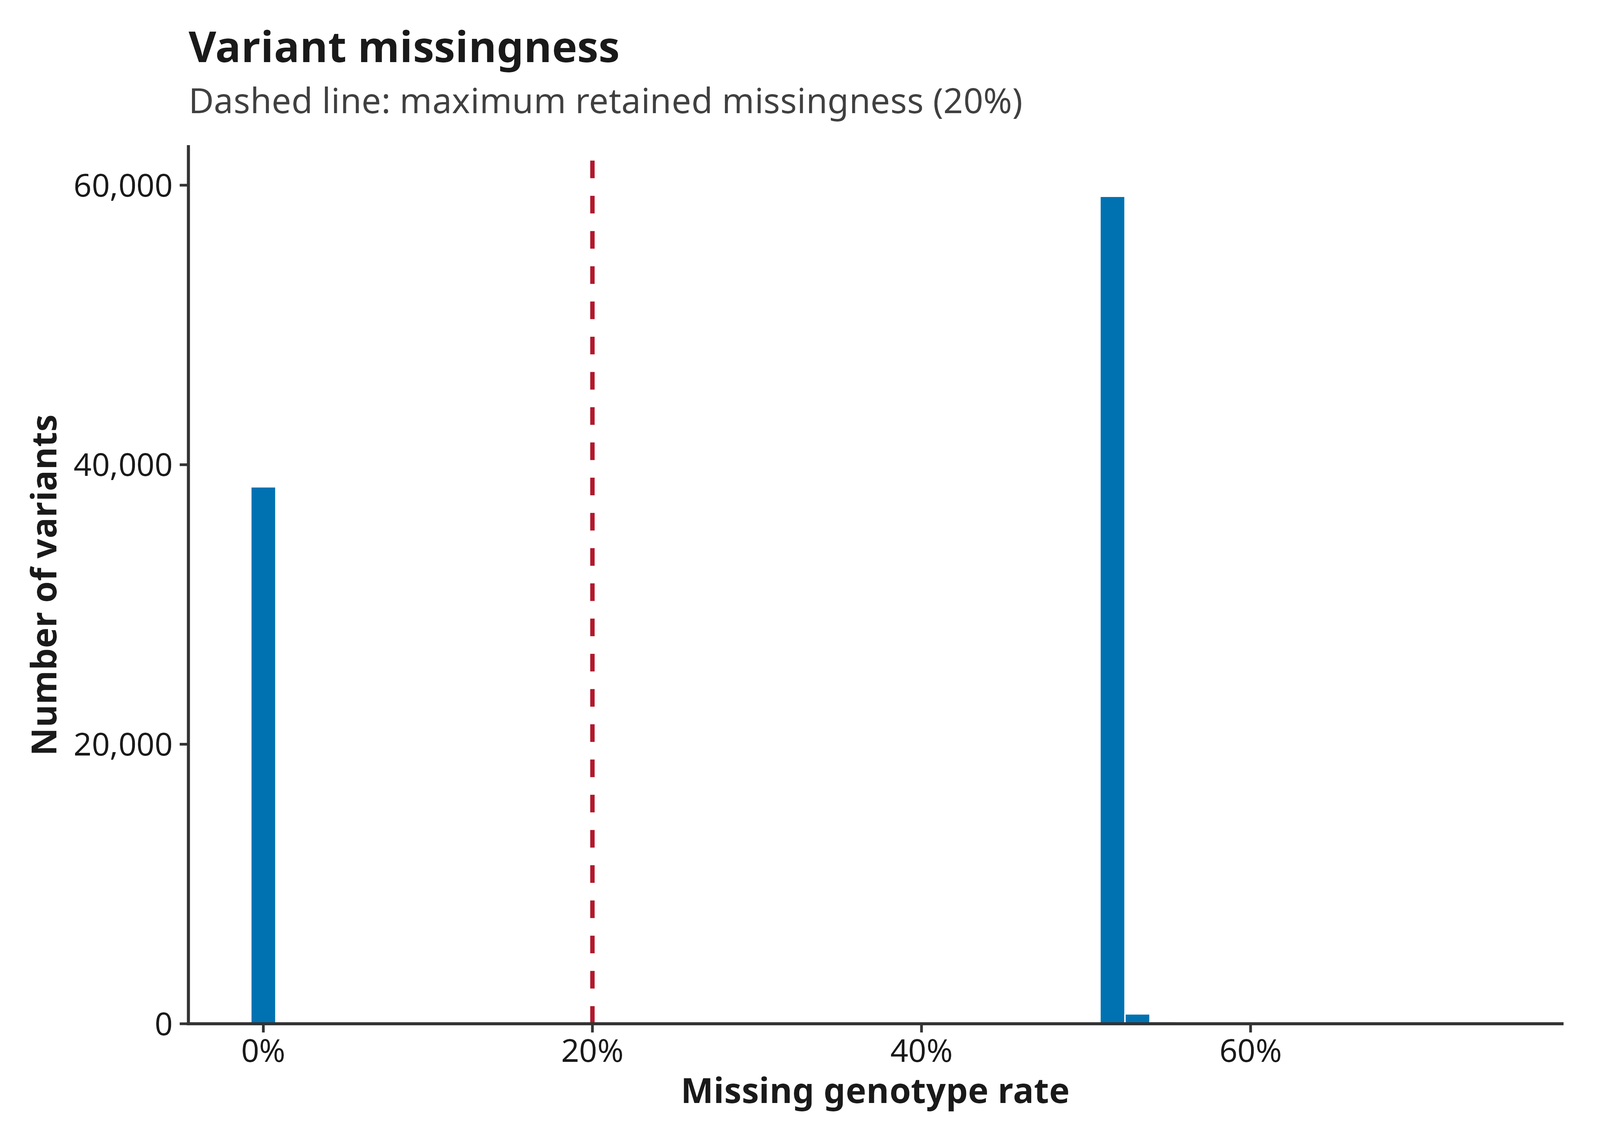
The bimodal shape above is that same sex-chromosome story rendered directly: the left peak is well-covered autosomal markers near 0% missingness, and the right peak just past 50% is chromosome X/Y markers missing across roughly half the cohort (hemizygous or absent in one sex) – not a data-quality failure, the exact mechanism described above.
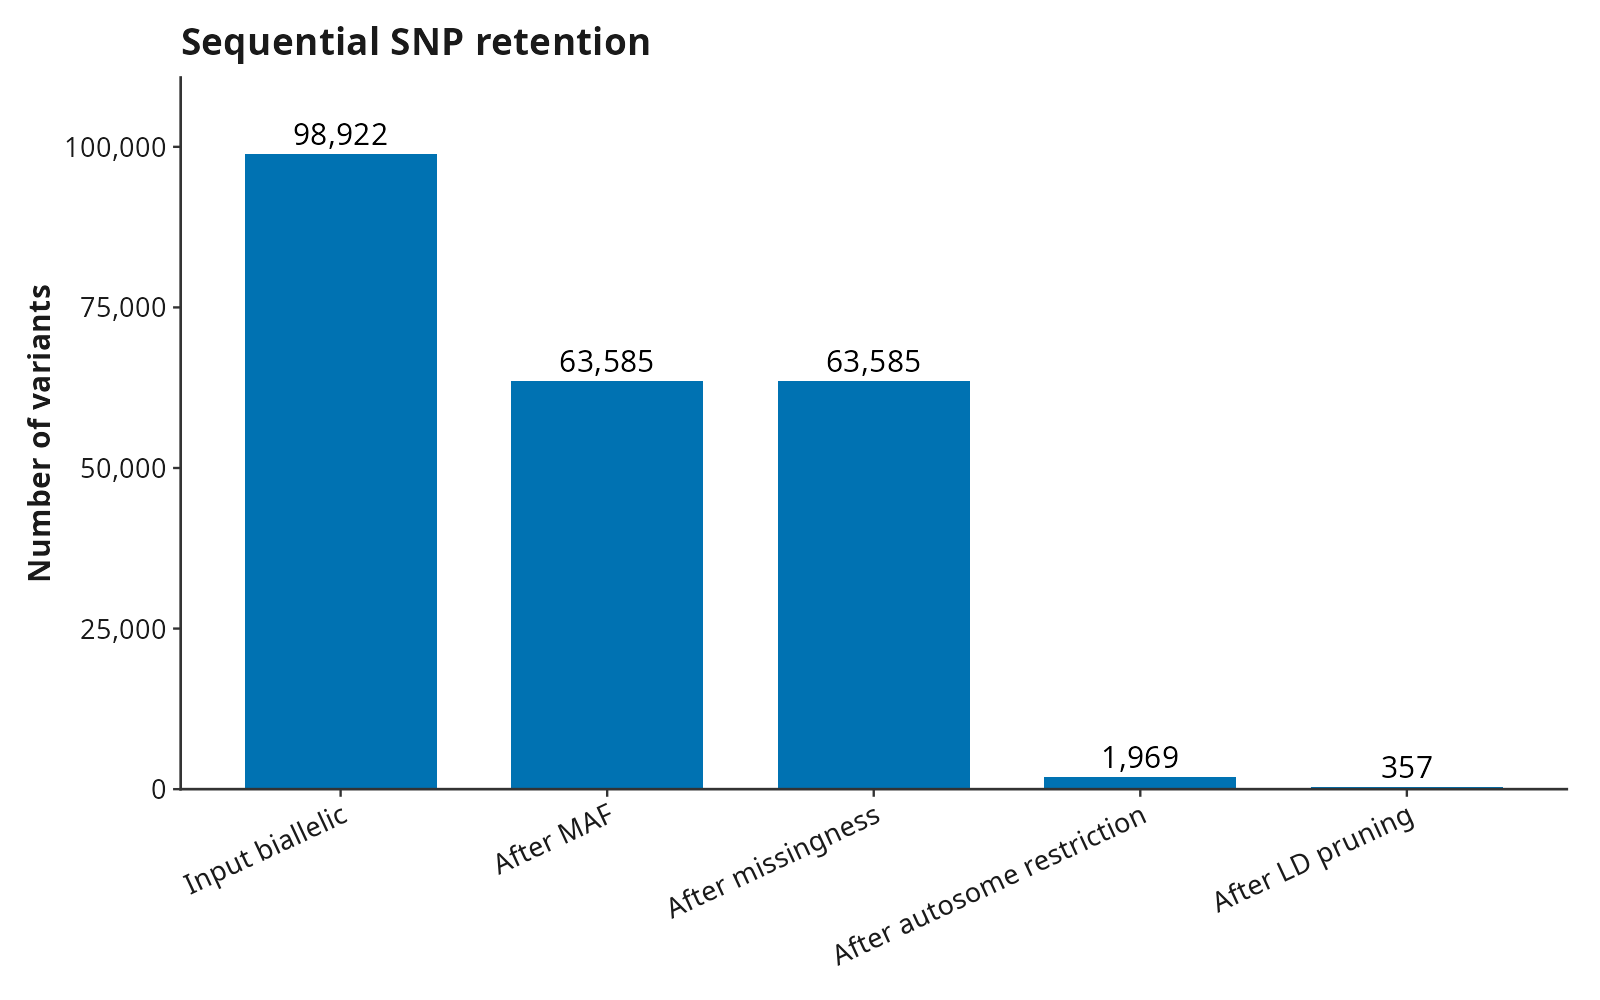
The funnel above is the same sequence of numbers just quoted, in
order: input (98,922), after MAF (63,585), after missingness (identical
to after MAF here – this cohort’s variants are either well-covered or
not called at all, nothing in between to filter further), after the
autosome restriction (1,969 – the 61,616 chromosome X/Y markers set
aside for the sex-check module leave the analysis set here, by far the
largest single step), and after LD pruning to the 357-SNP final marker
set. The autosome-restriction row appears only when
qc.autosome_only actually removes markers; before 1.0.16
its removals were booked to the LD-pruning step.
PCA
Principal components summarize directions of variance in the analyzed genotype matrix. Separation can reflect population structure, family relationships, batch effects, uneven missingness, marker ascertainment, inversions, or geographic clines.
Interpret the eigenvalues and source coordinates together. Do not assign discrete populations solely from visual clusters. Examine whether patterns persist after removing close relatives, high-LD regions, or problematic samples. Axis signs are arbitrary; only relative geometry is meaningful.
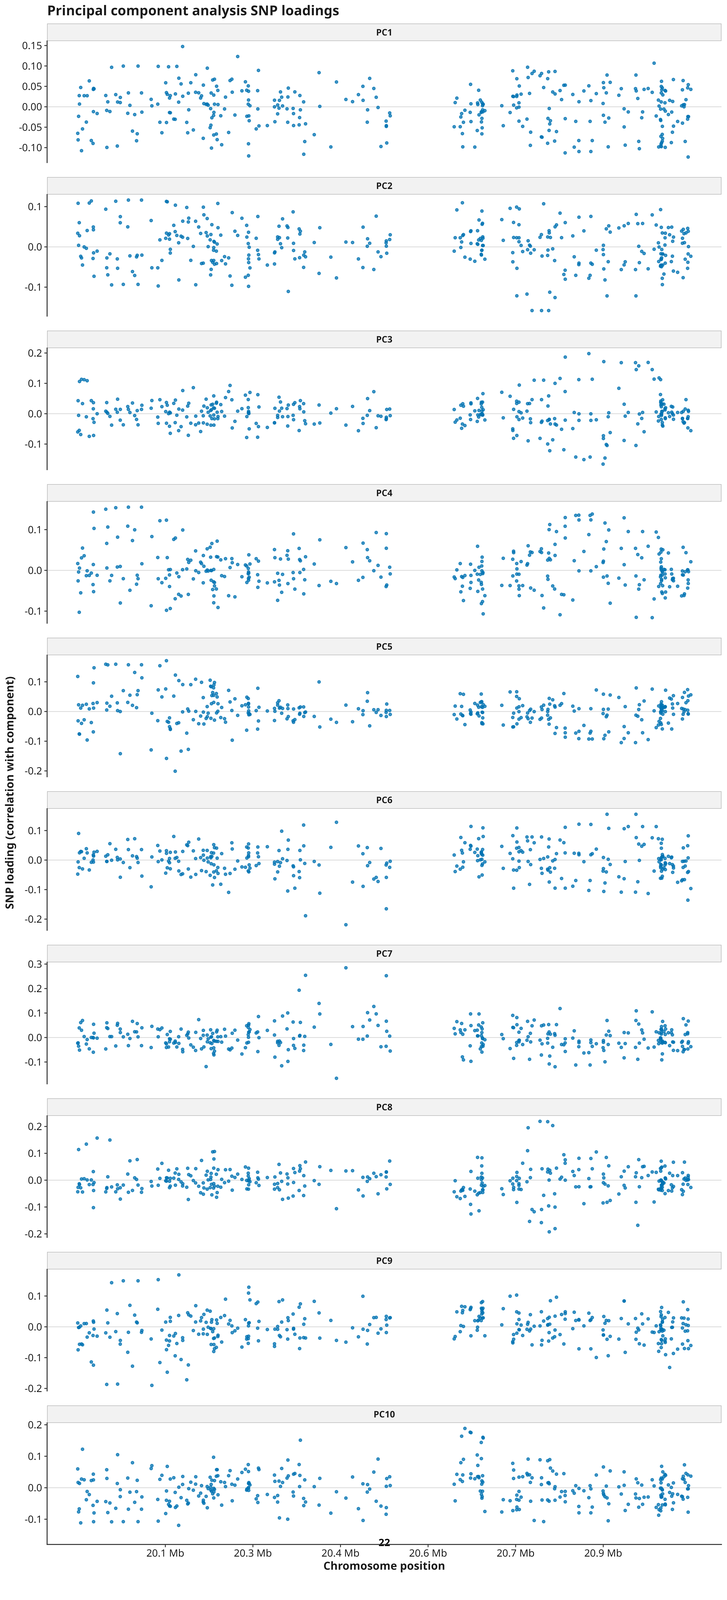
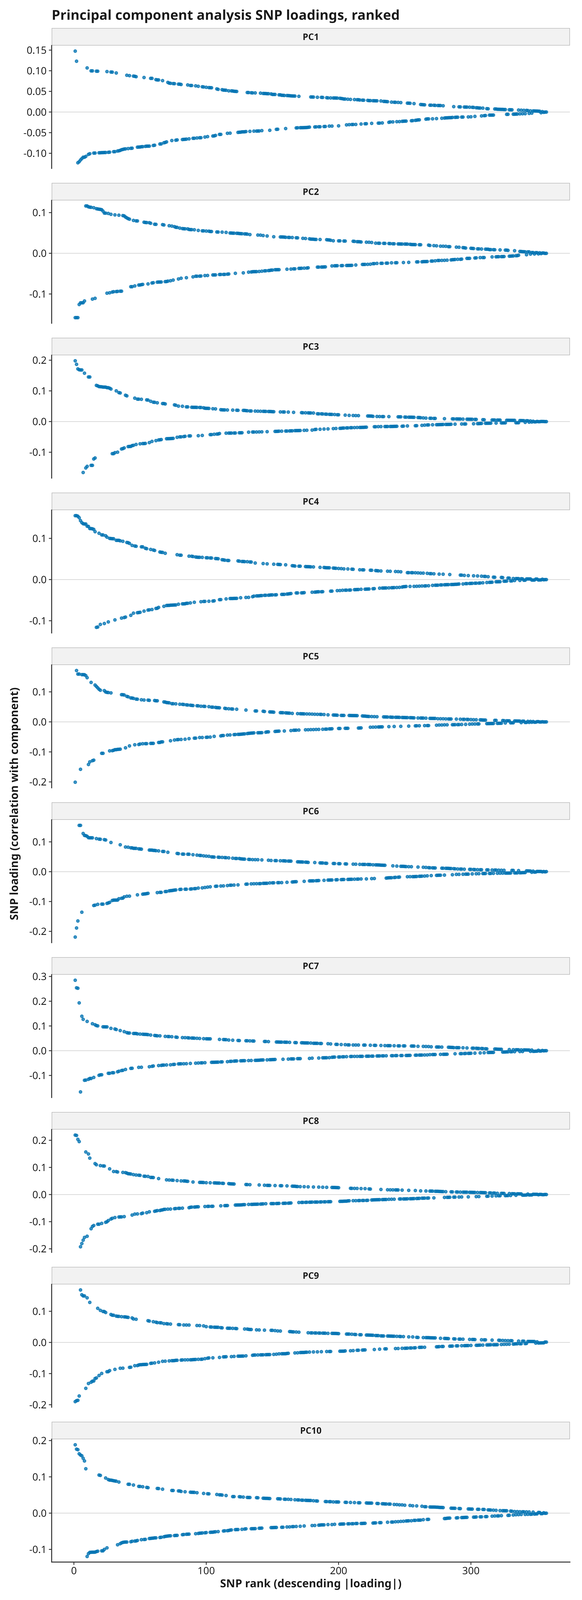
31_PCA_loadings.tsv, plus a genomic Manhattan-style
figure and a rank-ordered figure, report each SNP’s signed correlation
with every retained component. Ranking is by magnitude, not raw value,
since a large negative loading is just as informative as a large
positive one. A high-magnitude loading marks a marker associated with an
axis; it is not evidence that the marker is causal without independent,
functional follow-up.
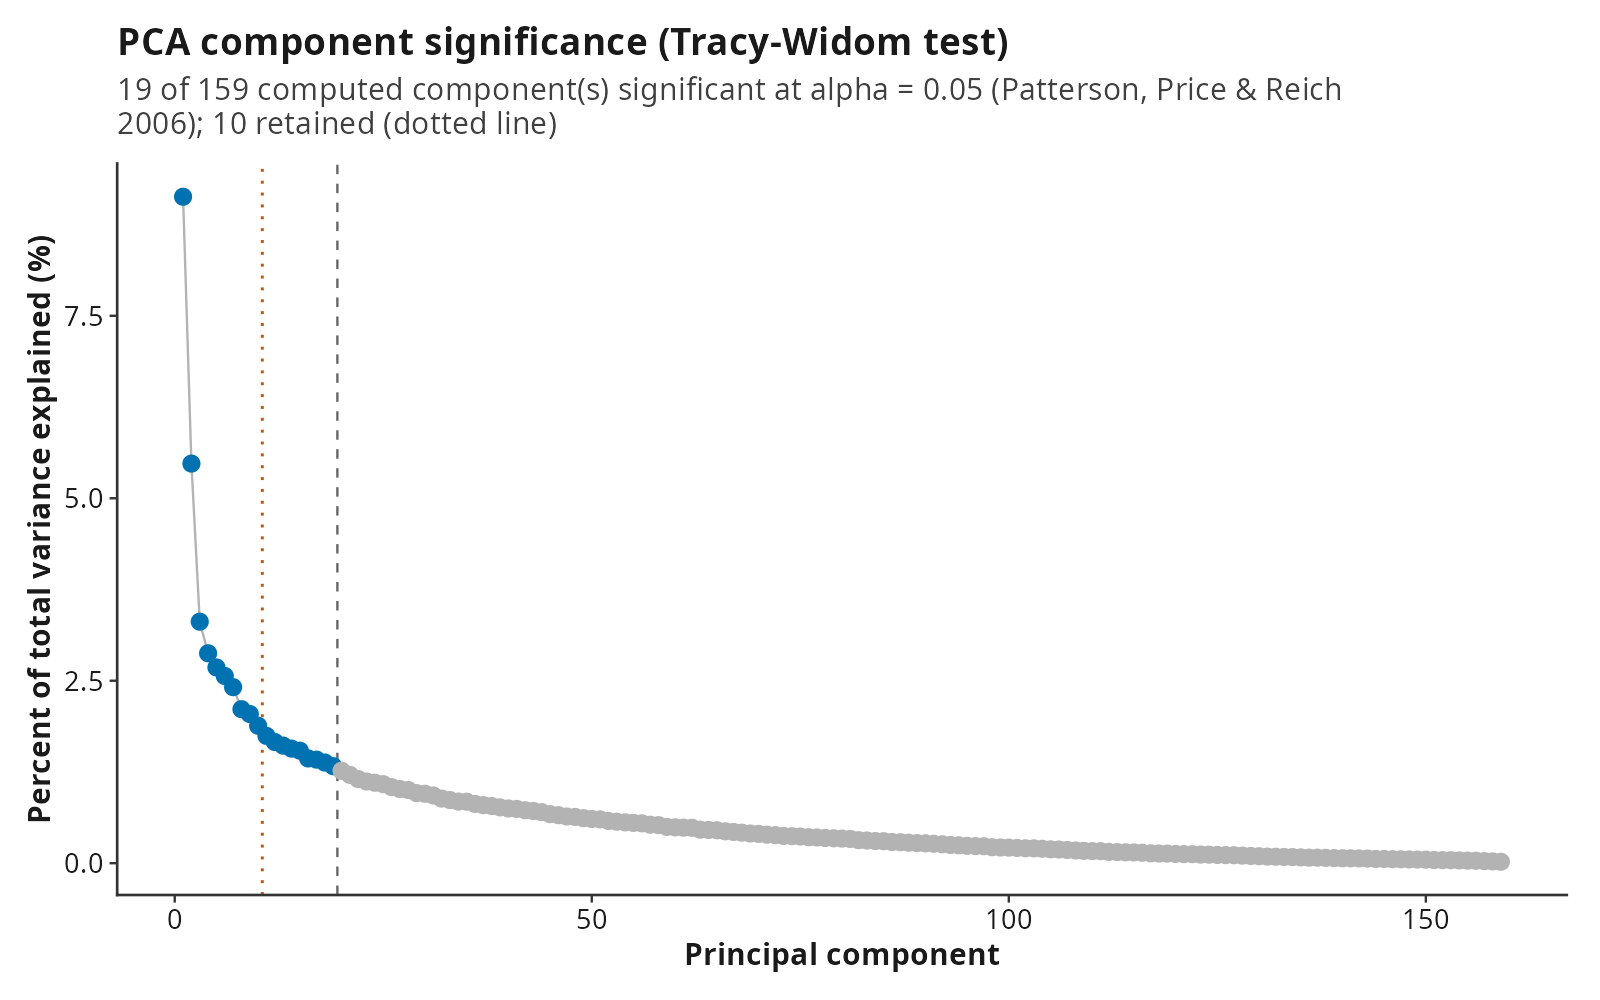
analyses.n_pcs is a fixed integer by default (10 in the
quickstart example), but every run also compares that choice against the
sequential Tracy-Widom eigenvalue significance test (Patterson, Price
& Reich 2006 – the same test EIGENSOFT’s smartpca uses
for its own automatic PC-count selection), letting you check how close a
fixed choice is to the data-driven one without committing to it. In the
quickstart example, 19 of 159 computed components are
Tracy-Widom-significant against the fixed choice of 10 – the dashed line
marks the significance cutoff, the dotted line marks the fixed 10
actually retained. Set analyses.n_pcs: "auto" to retain the
Tracy-Widom-significant count directly instead of a fixed number
(requires the LEA package; the comparison figure itself
degrades gracefully – a warning, not a hard failure – if
LEA is unavailable and a fixed n_pcs was
requested).
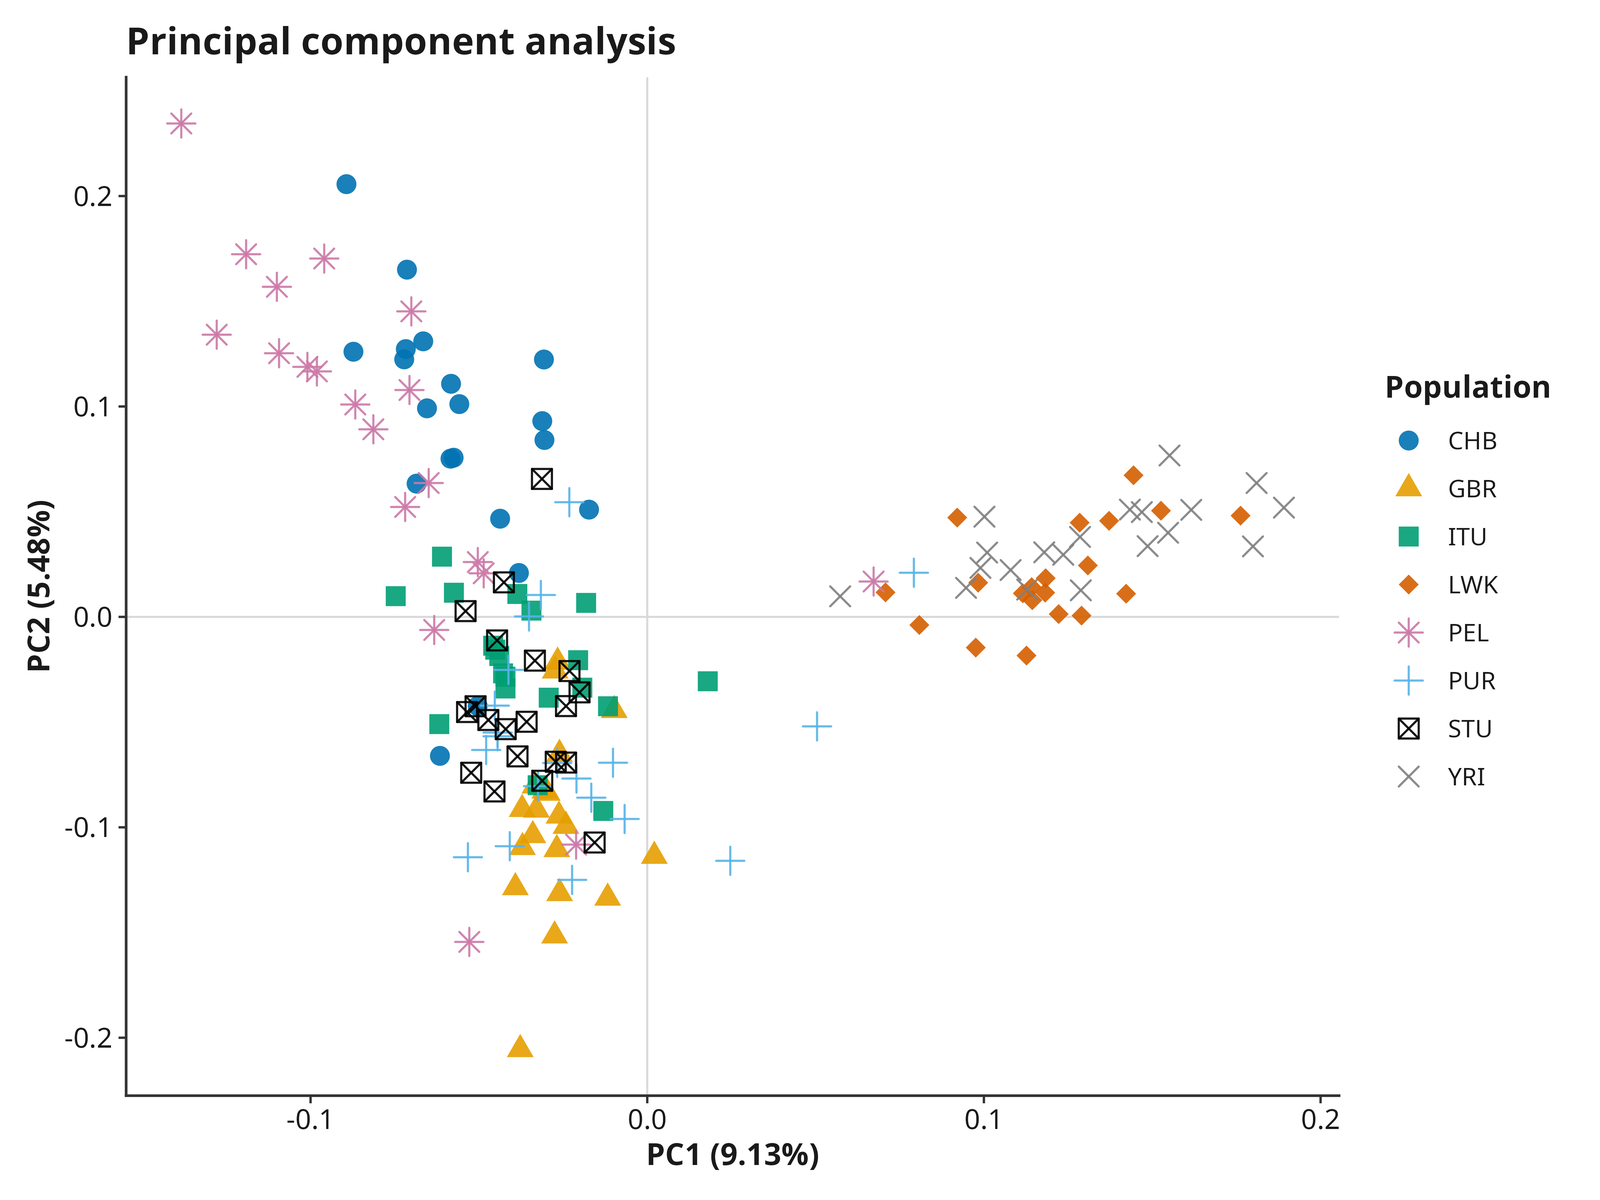
The 8 populations in the quickstart example separate largely by continental origin along PC1/PC2, as expected for real, geographically diverse human samples.
The report also draws one additional PC1/PC2 panel per other metadata
column that qualifies for colouring: enough samples per distinct value
(analyses.pca_metadata_color_min_group, default 3) and not
too many distinct values
(analyses.pca_metadata_color_max_levels, default 12).
population itself, continuous coordinates
(latitude/longitude), and identifier-like
columns are excluded automatically. In the quickstart metadata,
sex qualifies:
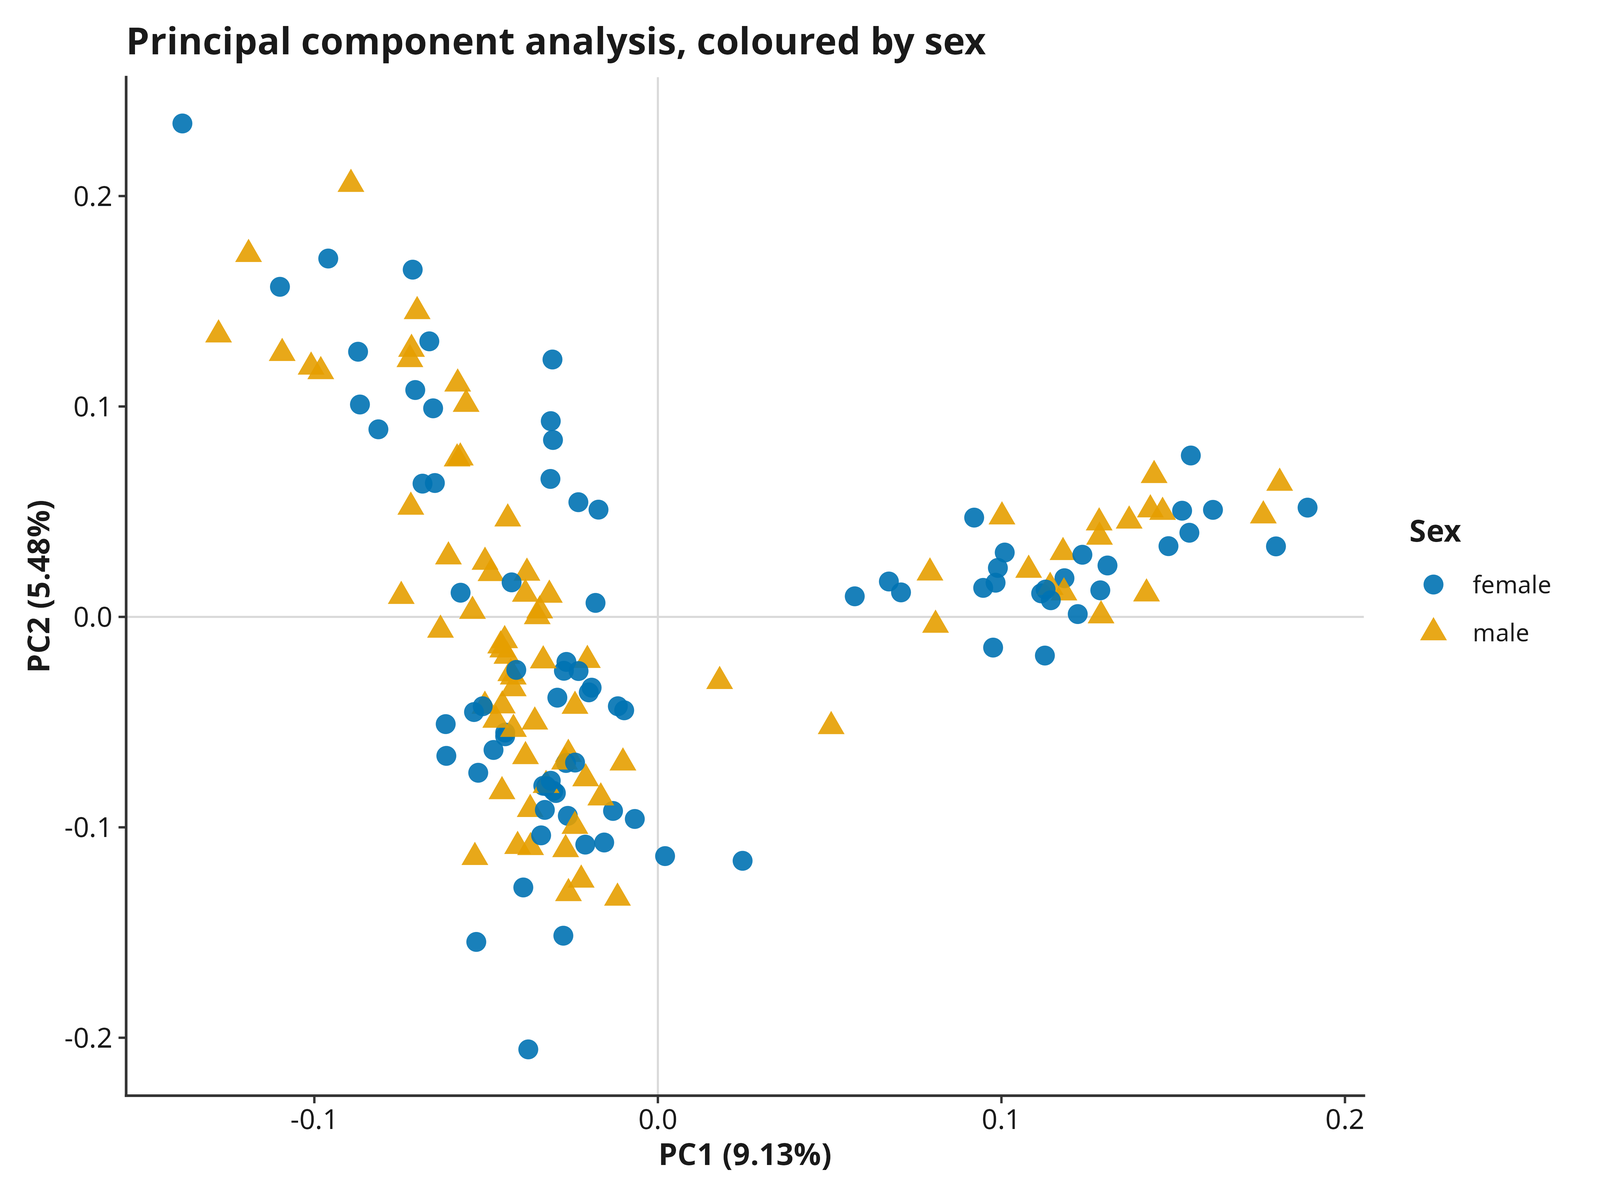
Sex shows no separation here (ANOVA on this exact PCA fit: p = 0.24 on PC1, p = 0.62 on PC2) – itself the expected, useful result for an autosomal analysis: population structure, not sex, drives this PCA. A per-metadata-column panel that does show separation on your own data would be a genuine signal worth investigating (a batch effect, a confound, or real biology), not something to assume is noise.
IBS and MDS
Identity-by-state (IBS, SNPRelate::snpgdsIBS()) is a
simpler, symmetric similarity measure than kinship below: the fraction
of alleles shared between every pair of samples, with no explicit
relatedness model behind it. Multidimensional scaling (classical
stats::cmdscale() on the 1 - IBS distance matrix, Zheng et
al. 2012) projects that pairwise matrix into low-dimensional coordinates
for visualization – the same purpose as PCA above, but built from a
similarity matrix rather than the raw genotype matrix directly, so treat
it as a complementary view, not a substitute.
Confirm sample order and matrix symmetry before trusting either the
heatmap or the MDS coordinates. Interpret low-dimensional MDS only after
checking how much variance each axis actually explains:
cmdscale() can produce negative eigenvalues for a
non-Euclidean distance like IBS (goodness-of-fit is computed from the
positive eigenvalues only), and a low percentage means the 2D plot is
compressing away real structure, not that little structure exists. Close
pairs in either view may reflect relatives or duplicates rather than
population-level structure – the Kinship section below is the right tool
to tell those apart, not IBS/MDS alone.
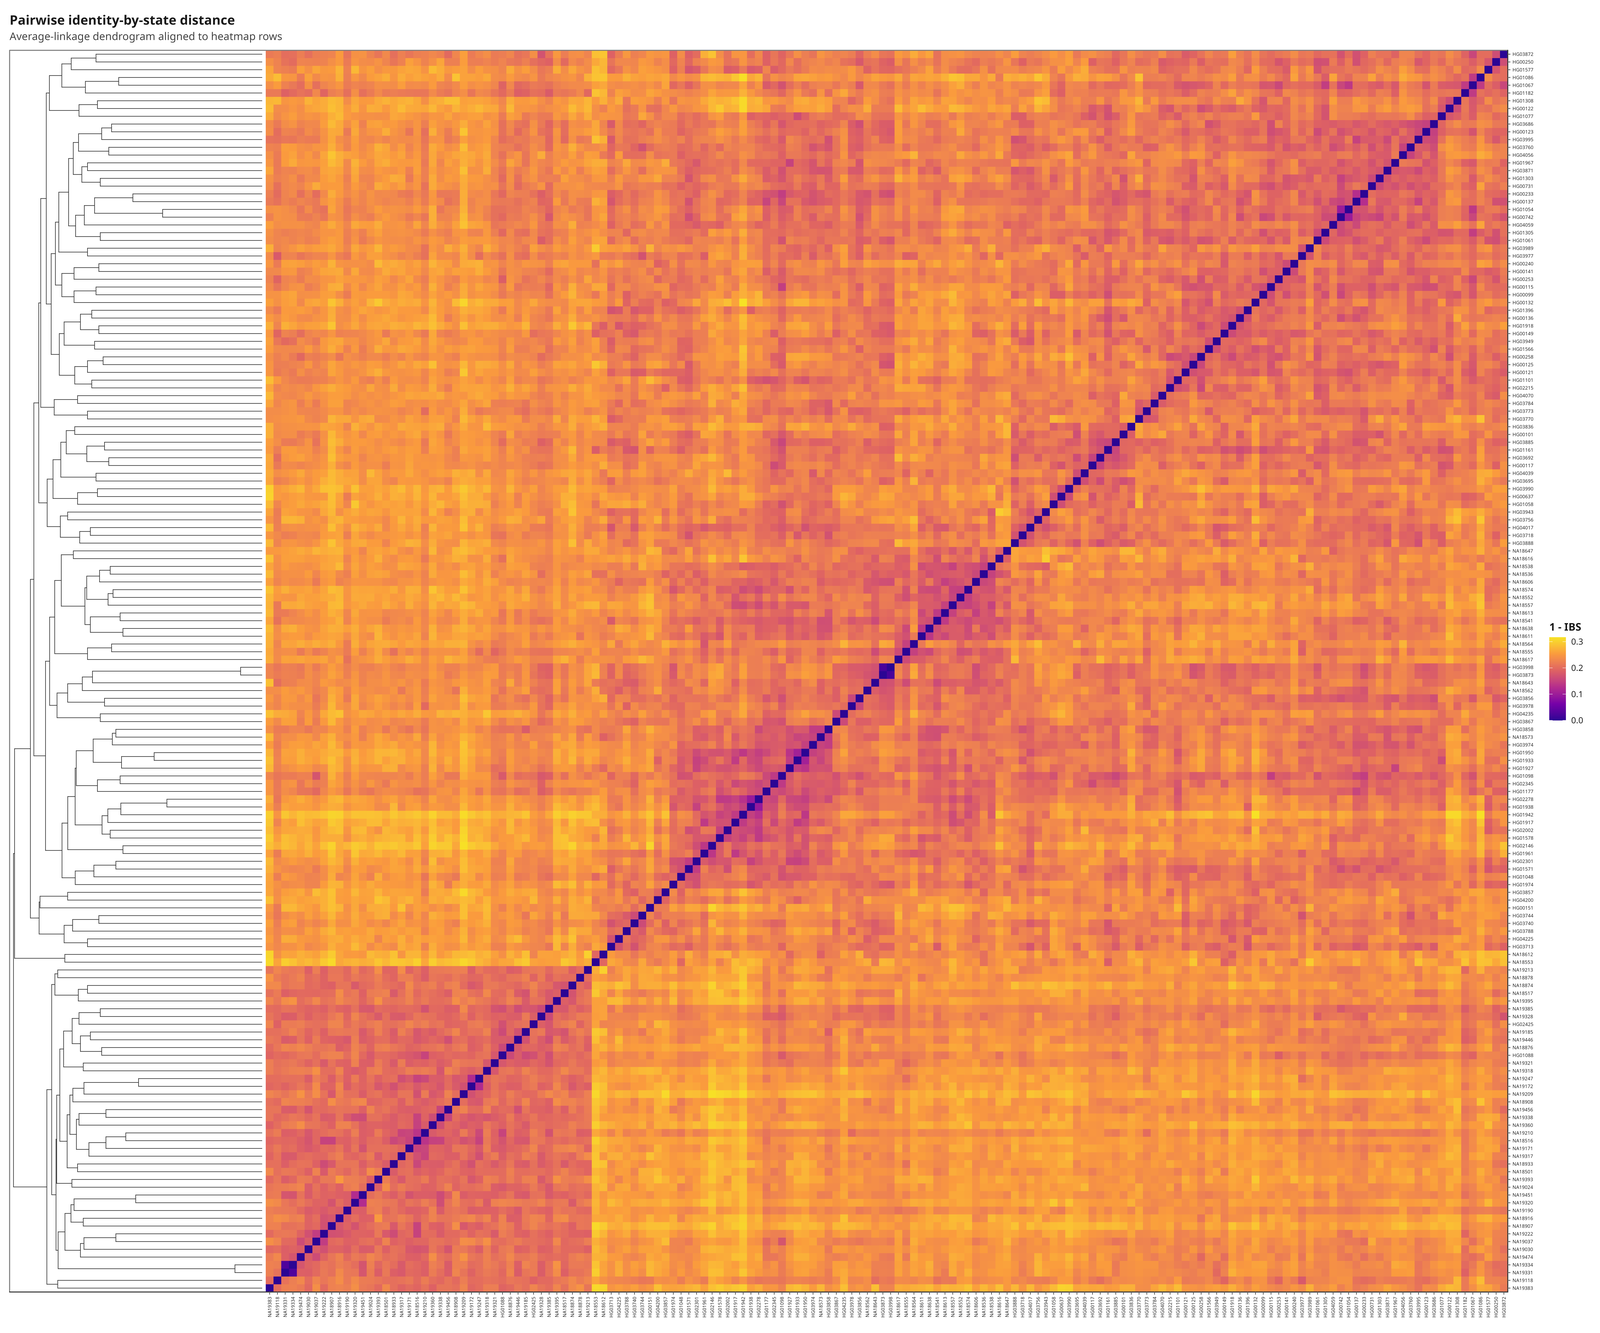
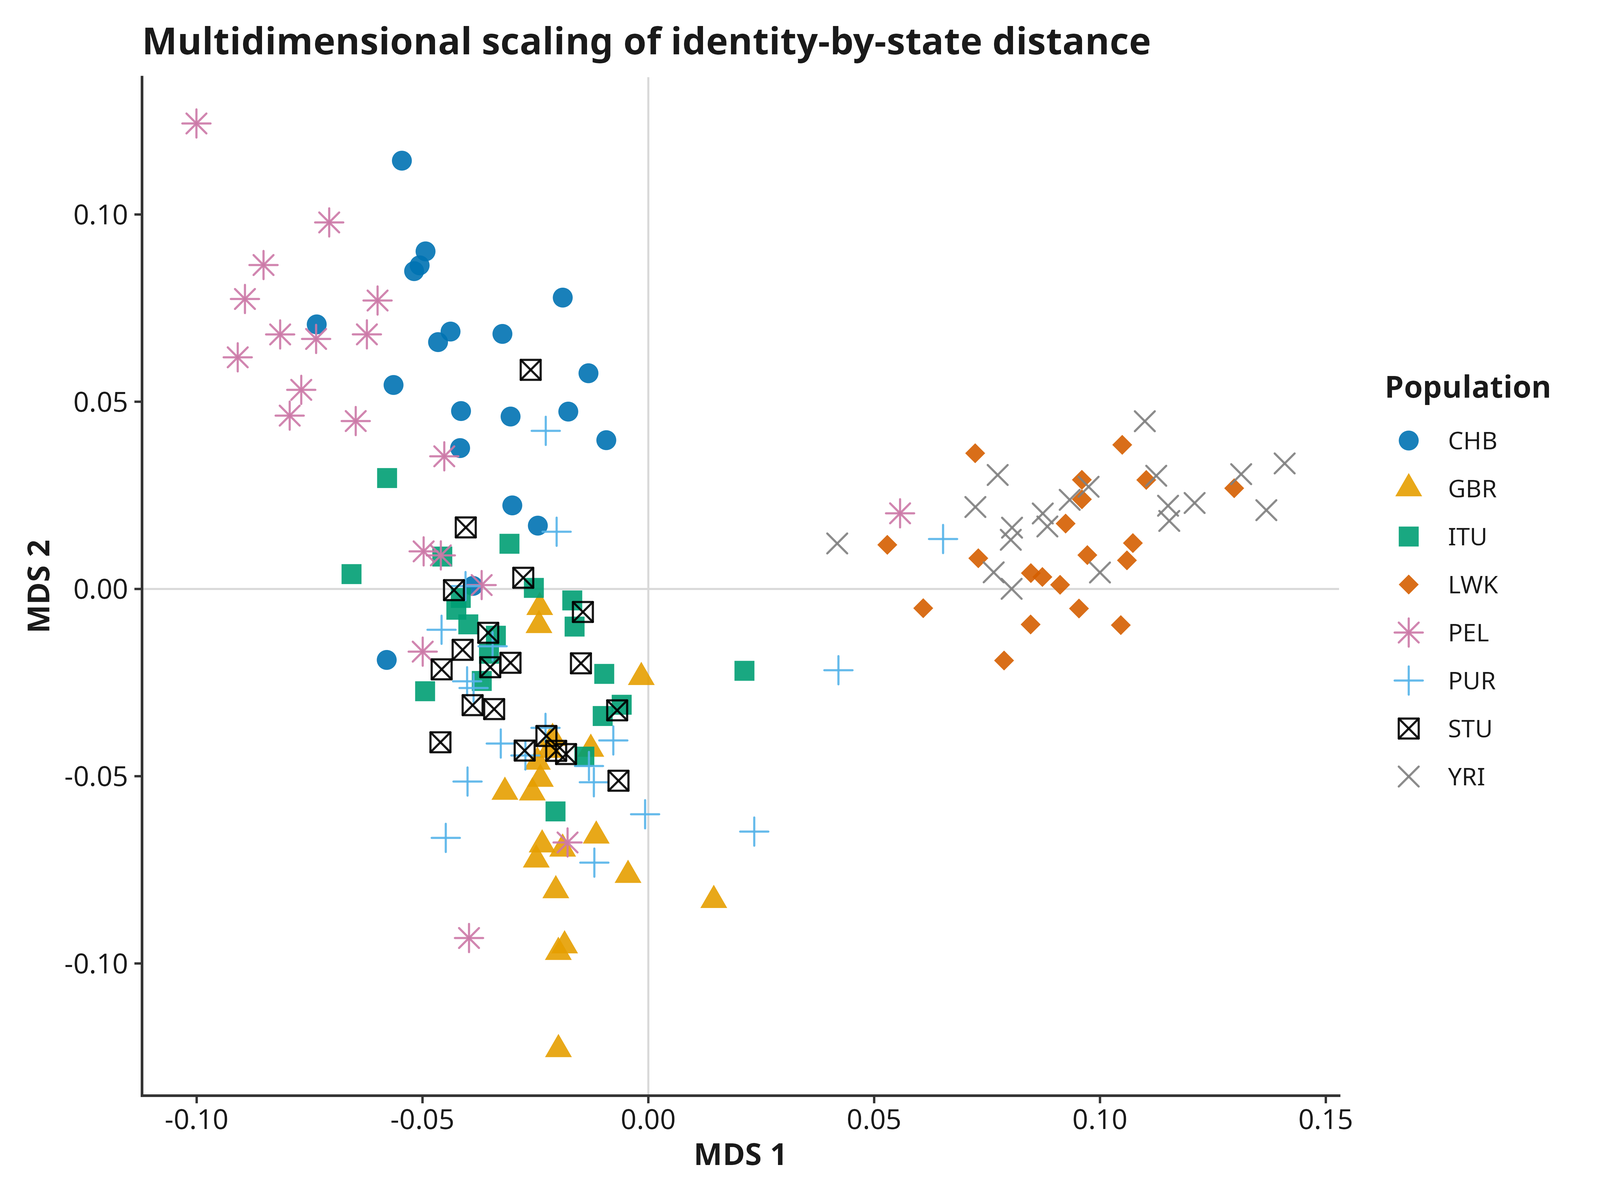
On the quickstart example, MDS1 and MDS2 explain 11.97% and 6.99% of
the positive-eigenvalue variation respectively (65 of the 160
eigenvalues are negative – an expected property of IBS-based distances,
not an error). Modest but real: MDS1 alone already separates the two
African populations (LWK, YRI) from the rest (ANOVA on MDS1 by
population, p = 5.5e-64), the same continental pattern PCA recovers
above, now from a completely different starting matrix (pairwise
allele-sharing rather than PCA’s genotype covariance structure) – an
independent confirmation, not a re-derivation of the same PCA result.
The single highest pairwise IBS similarity in the whole dataset (0.979)
is HG03873/HG03998 – the same pair the next
section flags as a kinship “duplicate/MZ twin” call that turns out, on
corroborating sex-check evidence, not actually to be one; worth keeping
in mind while reading that section.
The same IBS distance matrix also builds a neighbour-joining tree
(Saitou and Nei 1987), a third view of the same pairwise relationships
alongside the heatmap and MDS above – useful for reading off which
specific samples group together, not just how much variance
separates them. Bootstrap support (Felsenstein 1985;
analyses.tree_bootstrap, on by default, 100 replicates) is
shown at each internal node: loci are resampled with replacement, the
tree rebuilt from each resampled set, and the percentage of replicates
agreeing with each split in the original tree reported. Support is a
statement about this dataset’s marker panel – how consistently these
loci recover this split under resampling – not a probability the split
is historically true; low support on a small panel means “unresolved
here”, not “refuted”.
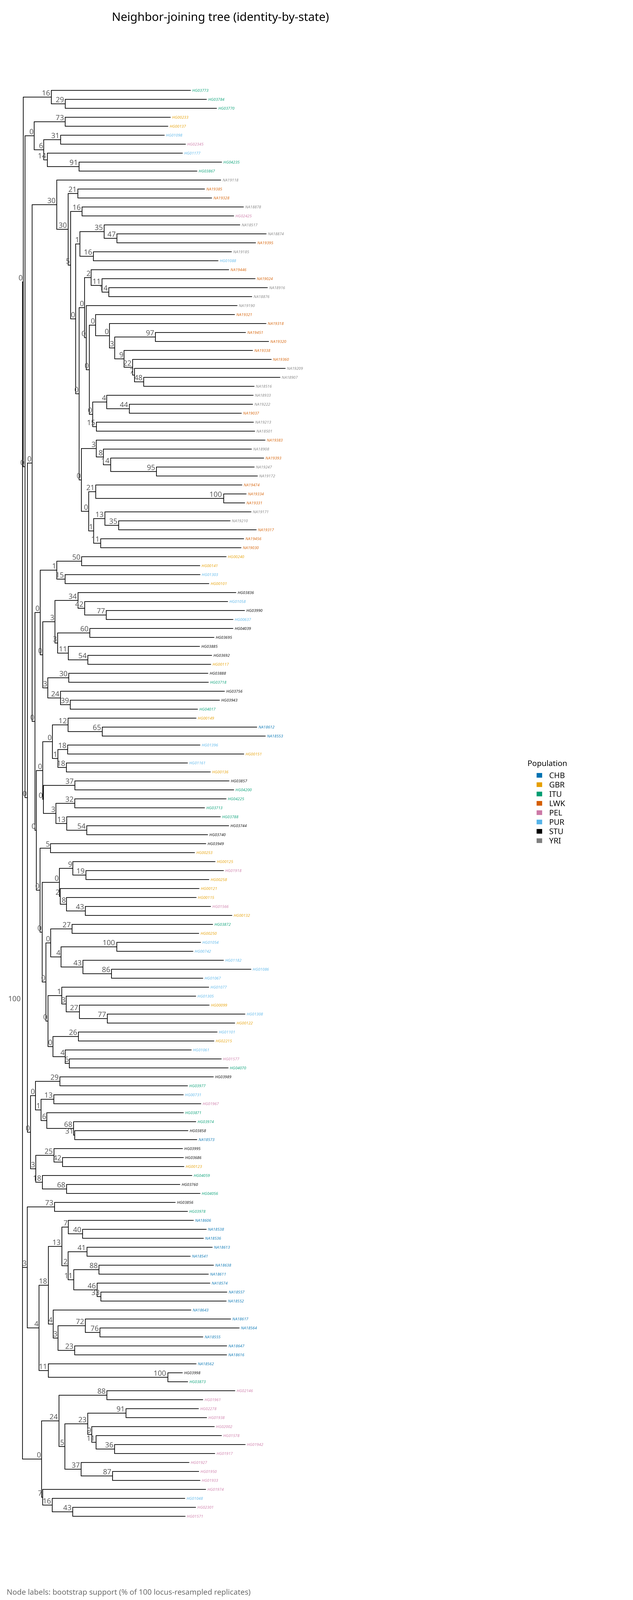
On the quickstart example (357 LD-pruned SNPs), most internal nodes show low bootstrap support (median 13%; 44% of nodes below 10%) – an honest, expected consequence of resolving fine-scale, individual-level relationships from a modest, LD-pruned marker panel, not a defect in the tree or the bootstrap procedure. The one split that matters most, though, is rock solid: the deepest split in the tree – separating the African (LWK, YRI) samples from everyone else, the same continental signal MDS and PCA both already found – has 100% bootstrap support. Read this tree for its well-supported deep structure, not for fine-scale terminal groupings, which this marker panel genuinely cannot resolve with confidence; a whole-genome VCF would show substantially higher support throughout.
Maximum-likelihood tree (optional)
analyses.ml_tree (off by default; needs the optional
phangorn package) builds a genuine maximum-likelihood
alternative to the NJ tree above: a configurable nucleotide substitution
model (analyses.ml_tree.model, default GTR;
any of phangorn’s supported models from JC up to
GTR – see the example config for the full list),
gamma-distributed among-site rate variation, and Lewis (2001)
ascertainment-bias correction, jointly optimized together with the
topology. The correction matters specifically because this is SNP-only
data – a VCF records no invariant sites at all, and an uncorrected
substitution model implicitly (and wrongly) assumes some were observed
and simply happened not to vary. Applies only to this individual-level
tree: ML substitution models describe per-sample sequence evolution, and
there is no standard, defensible way to apply them to the
population-level tree below, which is built from
allele-frequency distances, not per-sample sequences. Genotypes
are encoded as IUPAC nucleotide codes (homozygous calls become the plain
reference/alternate base, heterozygous calls become the standard
ambiguity code) so the existing biallelic ref/alt alleles double as a
sequence alignment; bootstrap support (100 replicates by default, same
Felsenstein 1985 procedure and interpretation as the NJ tree above) is
shown at each node the same way.
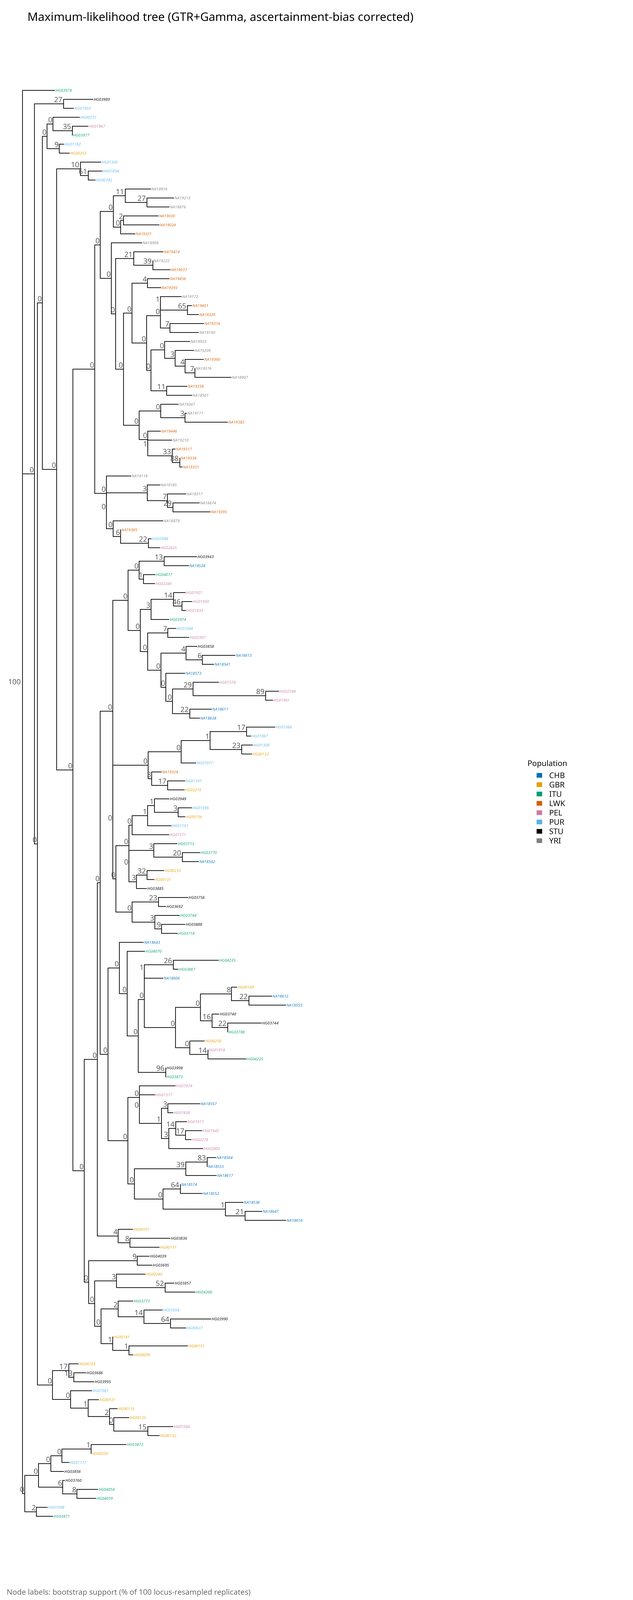
On the quickstart example, ML bootstrap support is even sparser than the NJ tree’s own (median 1%; 68% of nodes below 10%) – expected, not a regression: a proper likelihood-based method with an explicit substitution model is honestly more conservative than a simple distance method about what a modest, 357-SNP marker panel can actually resolve. Reassuringly, the one split both methods recover with full confidence is the same split: the tree’s root, separating the African (LWK, YRI) samples from everyone else, at 100% bootstrap support in both the NJ and ML trees – the same continental signal already found by PCA, MDS, and FST, now independently confirmed a fourth way, by a genuinely different statistical framework (explicit likelihood under a substitution model, not a distance transformation). As with the NJ tree, read this for its well-supported deep structure; a whole-genome VCF’s much larger marker panel would resolve substantially more of the tree with confidence.
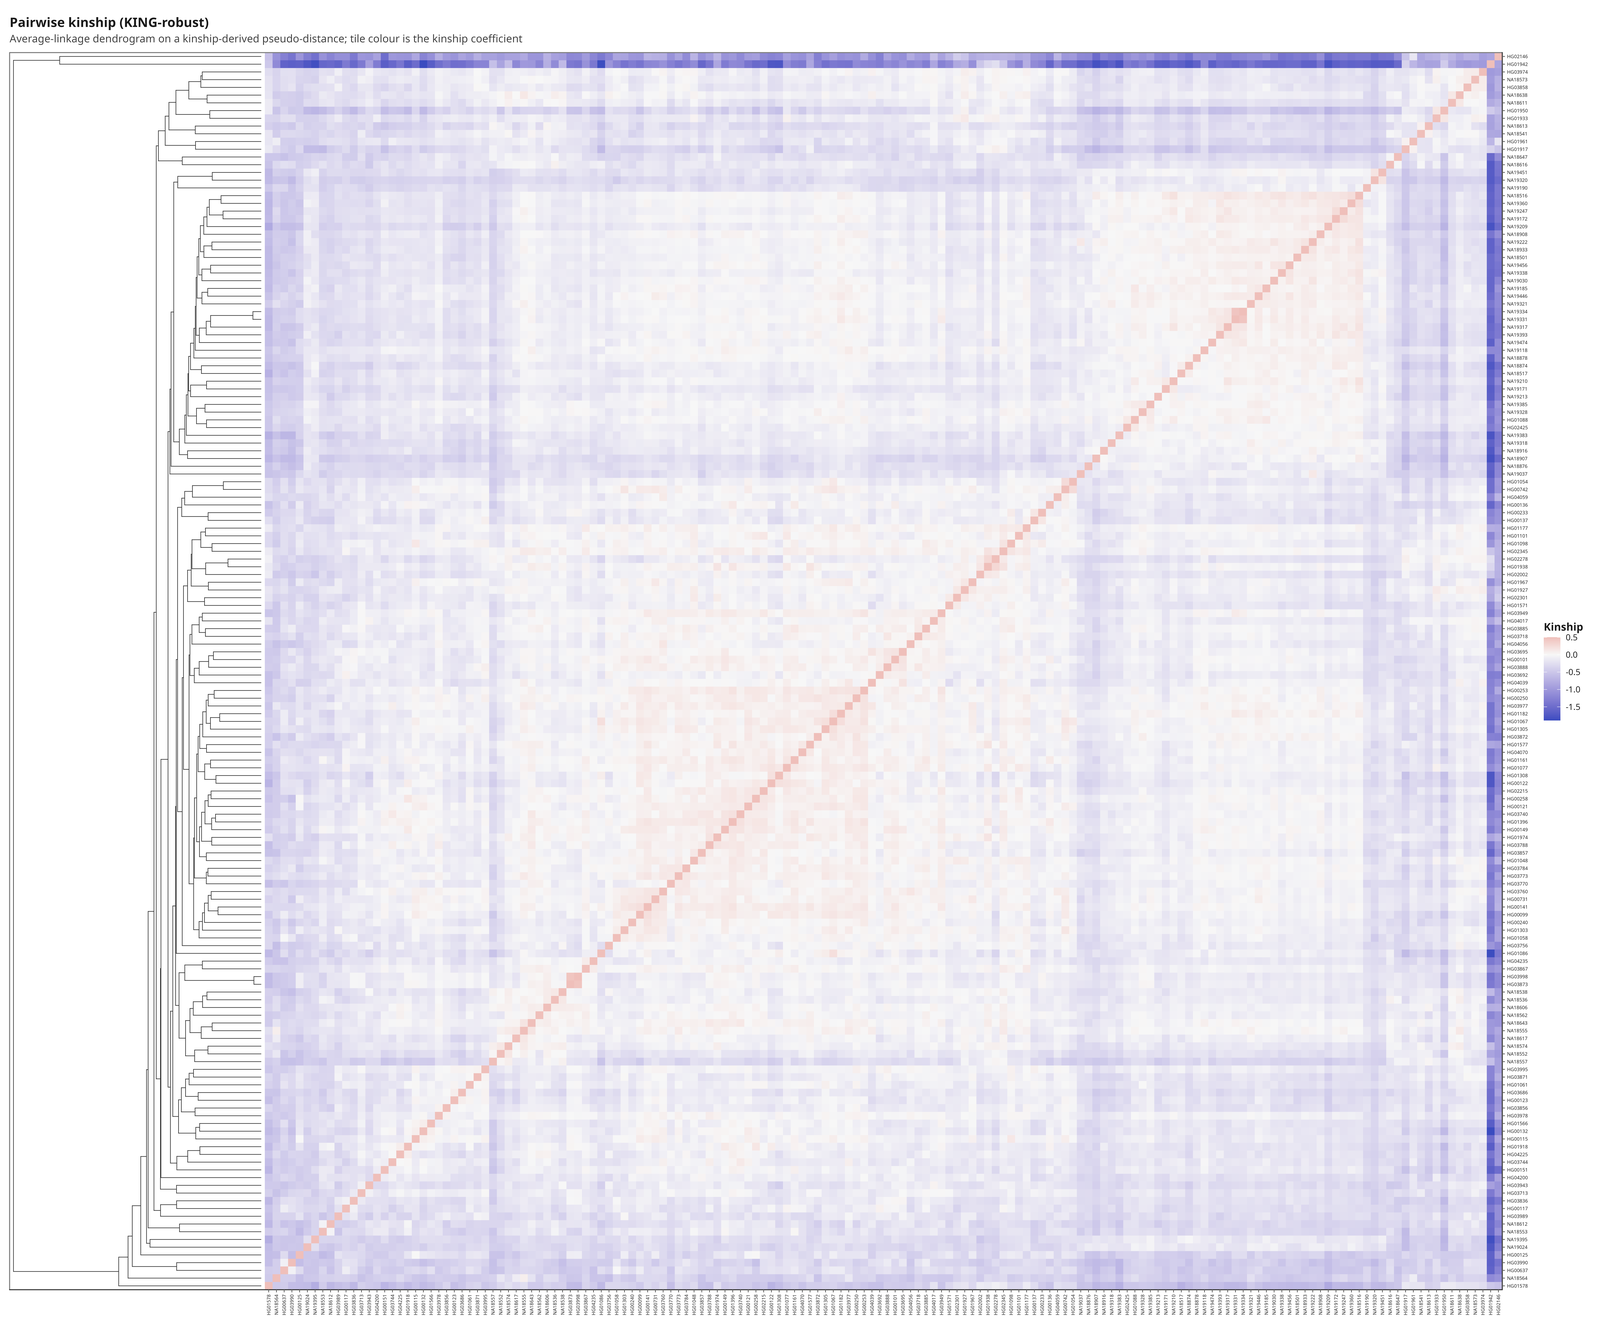
Kinship
Kinship (SNPRelate::snpgdsIBDKING(), KING-robust,
Manichaikul et al. 2010) answers a different question than IBS/MDS
above: not “how similar are these samples overall” but “are these two
individuals related, and how closely.” KING-robust is specifically
chosen for robustness to population stratification, unlike naive
relatedness estimators that assume a single homogeneous population – a
real requirement here, since this package explicitly supports analyzing
structured populations.
The estimator needs realistic marker density to behave sensibly; a
handful of SNPs produces values with no biological meaning, confirmed
concretely during this feature’s implementation against both an
undersized fixture and real chromosome-scale data.
relationship_degree uses the standard KING thresholds and
is a screening classification, not a pedigree diagnosis – a flagged pair
warrants follow-up (sample duplication, family structure in the study
design, or a labeling error), not an automatic conclusion. Kinship is
bounded above at 0.5 (a self/duplicate pair) but is not bounded
below at -0.5 for arbitrarily divergent pairs; very negative values are
expected, not an error, when comparing highly differentiated
populations. Detected close relatives can bias the FST, diversity, and
structure analyses computed from the same sample set – consider whether
to exclude or account for them before interpreting those results.
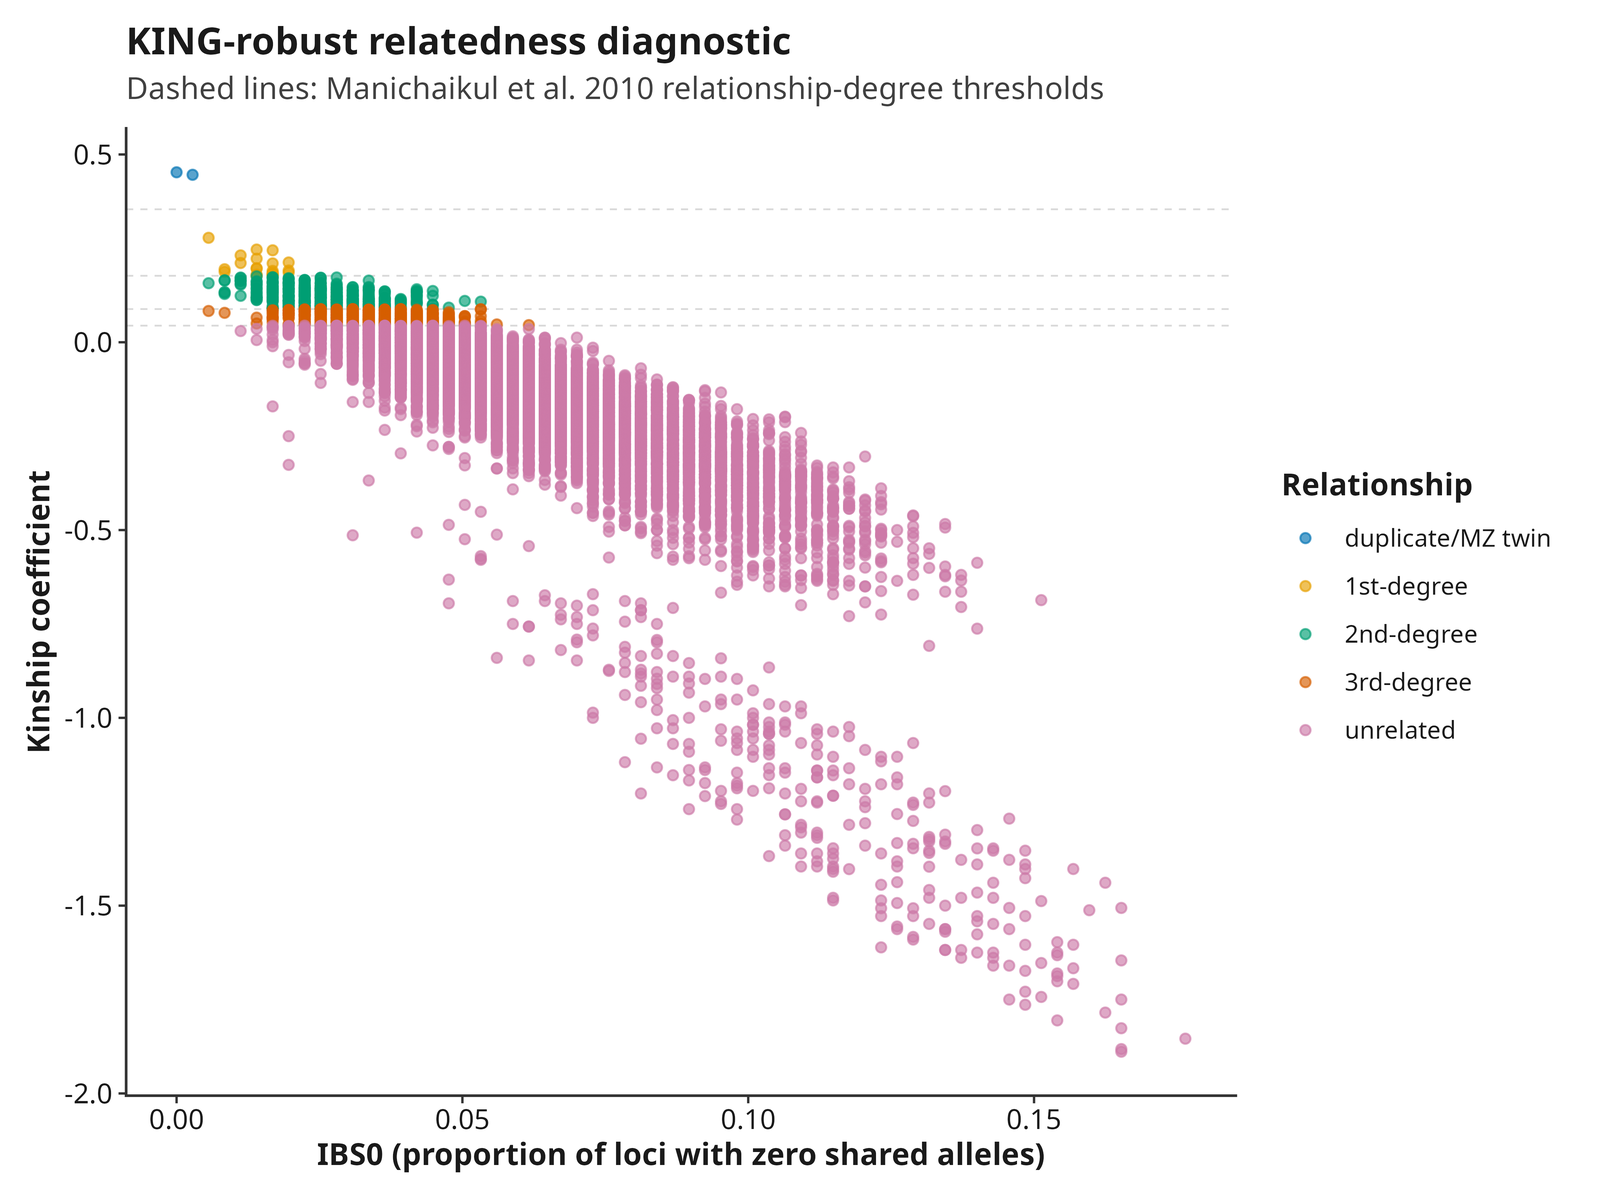
The quickstart dataset deliberately includes a known real
duplicate/MZ-twin pair, NA19331/NA19334
(kinship 0.4459, both LWK, correctly classified
duplicate/MZ twin), confirmed consistent on chromosome X
too: both are genuinely male (real hemizygous chromosome X genotypes,
not just a metadata label), matching each other with no contradicting
evidence.
HG03873/HG03998 (kinship 0.4525, also
classified duplicate/MZ twin) is a more interesting
cautionary example, not a second confirmed duplicate: their real
chromosome X genotypes show HG03873 is genuinely female and
HG03998 is genuinely male (not just a metadata discrepancy
between two population labels, ITU and STU) – and MZ twins share genetic
sex by definition, so despite the high chr22-only kinship, this pair
cannot actually be the same individual or identical twins. The autosomal
kinship signal is real (not a computation error), but a single small
autosomal window is not sufficient evidence for “duplicate” on its own;
the sex-check module below is exactly the kind of corroborating,
independent evidence needed before accepting a kinship-based duplicate
call as biological fact. Treat a single flagged pair as a lead to
investigate, not a conclusion – this is a real example of why.
Sex check
Genetic sex inference from two complementary, independent signals –
X-chromosome heterozygosity and Y-chromosome genotype call rate – flags
samples whose metadata-reported sex disagrees with what
their genotypes imply, PLINK’s --check-sex convention
extended the way real sex-check pipelines actually use it. X-chromosome
heterozygosity (Visscher et al. 2010’s F-statistic, via
SNPRelate::snpgdsIndInb(method = "mom.visscher"), already
used elsewhere in this package) separates hemizygous males (excess
homozygosity, F close to 1) from diploid females (F close to 0); default
thresholds (male F > 0.8, female F < 0.2) are PLINK’s own
documented defaults, verified on a hand-built synthetic fixture before
shipping: simulated males gave F in [0.84, 1.13], simulated females in
[-0.06, 0.10]. Y-chromosome call rate
(SNPRelate::snpgdsSampMissRate(), already an SNPRelate
dependency) is a second, much cleaner signal: males have a Y chromosome
to call genotypes from, females do not. Verified against real 1000
Genomes data before shipping: females showed exactly 0.0 call rate,
males 0.995-1.0 – an almost perfectly binary separation, well clear of
the default thresholds (male > 0.5, female < 0.1).
When both signals are available and agree, that is a high-confidence
call. When they are both available but confidently disagree, the
combined call is discordant – real, informative evidence of
a data problem, not averaged away. Either signal alone is used when only
one chromosome is present. Pseudoautosomal (PAR) regions on X are not
excluded by default, since their boundaries are genome-build-specific
and this package accepts VCFs from any build or organism; PAR SNPs
dilute, not reverse, the X-based separation.
This module needs only genotypes (no metadata required, though a
sex column enables the mismatch comparison) and is on by
default (analyses.sex_check). It skips transparently – no
table, no figure – only when both chromosomes have too few
QC-passing SNPs; either signal alone is used when only one chromosome is
present, exactly like Mantel/isolation-by-distance skipping without
coordinates.
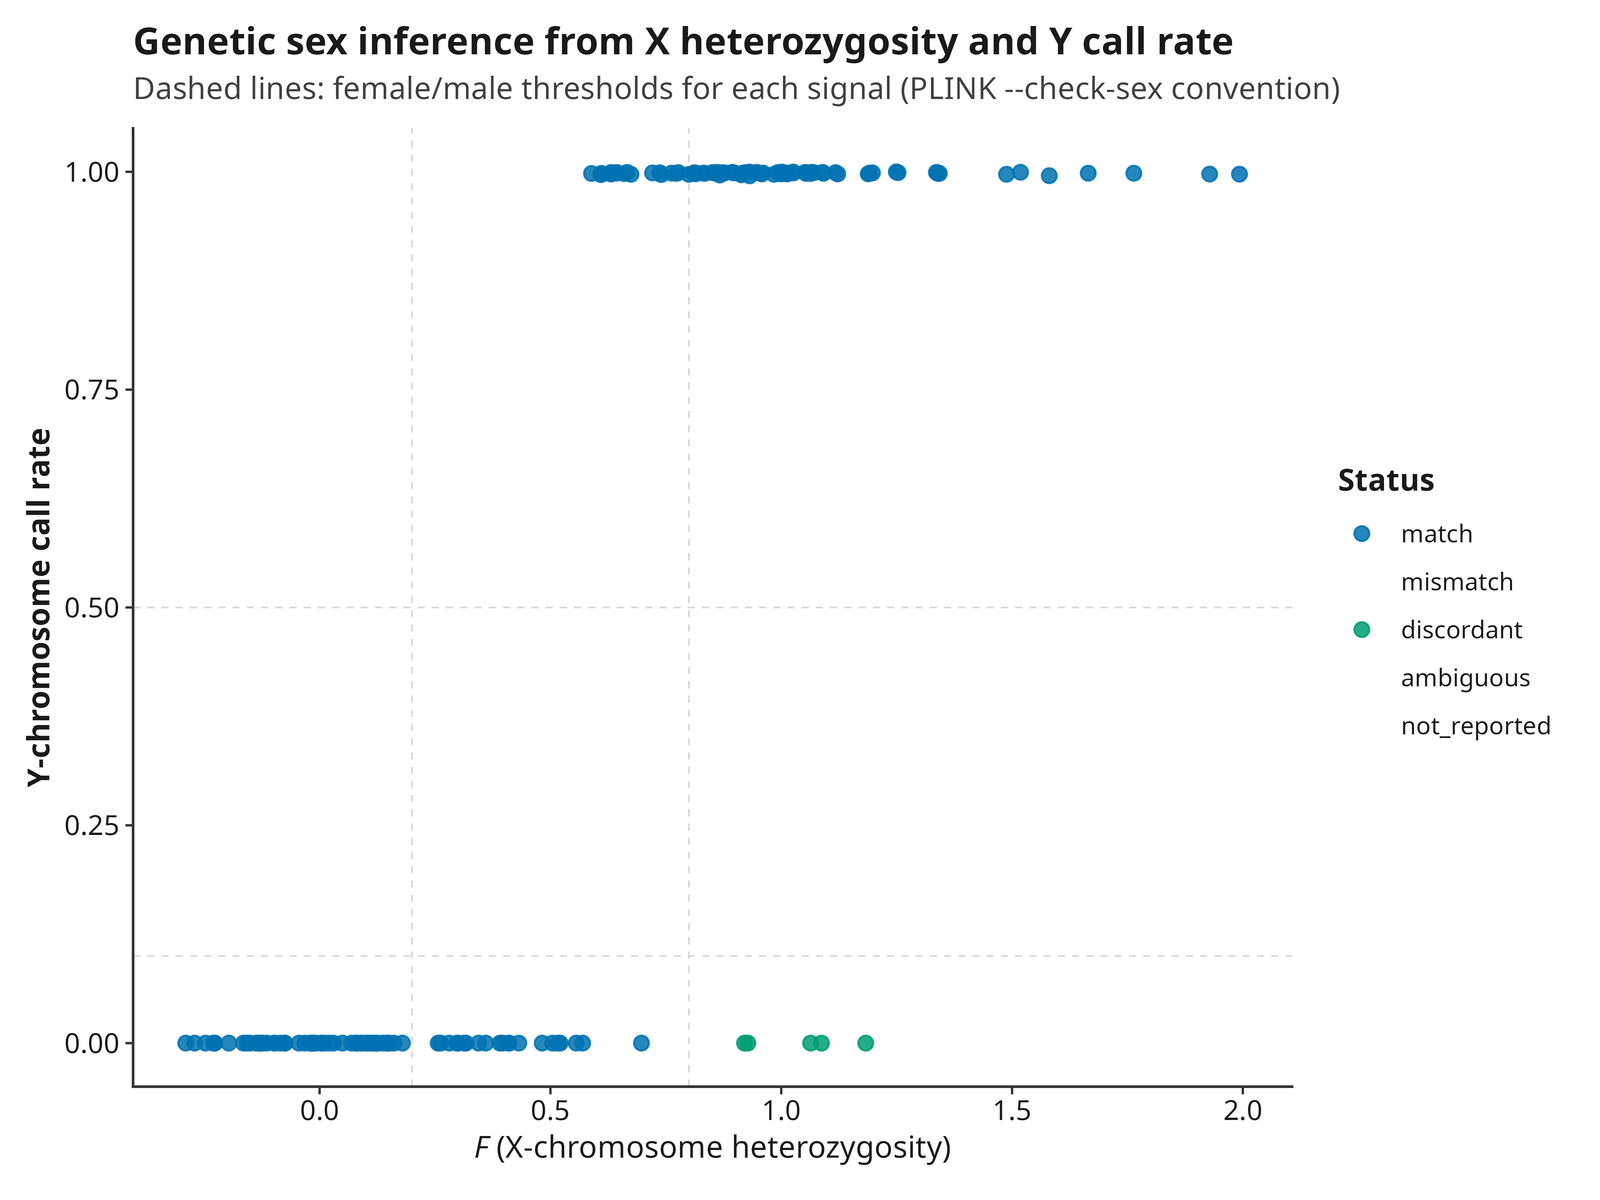
The quickstart example gives 1,148 QC-passing chromosome X SNPs and
60,468 QC-passing chromosome Y SNPs (both deliberately excluded from
every other module above, per the Quality control section). Of 160
samples, 155 classify as a confident match and 5 as
discordant – zero ambiguous, zero
mismatch. Combining the two signals resolved every one of
the 40 samples that were ambiguous on chromosome X alone
(X’s F-statistic, from a single bounded 1Mb region, is a noisier signal
than Y’s near-binary call rate) into a confident call. The 5
discordant samples are genuinely informative: all 5 have
real chromosome Y call rate of exactly 0 (confidently female) while
chromosome X gives a spurious male reading (F just above
the 0.8 threshold) – a real example of chromosome X’s small-region noise
producing a wrong call that chromosome Y’s cleaner signal catches,
exactly the value of using both signals together rather than trusting
either alone. All 5 samples’ metadata-reported sex is
female, agreeing with the chromosome Y evidence. A
follow-up check against genome-wide (not just this bounded region)
chromosome X data for these same 160 samples independently confirmed
this: zero genuine mismatches remained at that scale, and these same 5
samples resolved to female.
Runs of homozygosity
Runs of homozygosity (bcftools roh, an HMM-based method,
Narasimhan et al. 2016) identify long stretches where a sample’s
genotype calls are consistently homozygous – a standard per-sample
autozygosity/inbreeding signal, distinct from both diversity’s
population-level FIS below and kinship’s pairwise relatedness above.
Allele frequencies are self-estimated from the analyzed samples
(there is no mechanism to attach an external reference-panel frequency),
so informative site count – and therefore sensitivity – drops with
smaller cohorts, confirmed concretely during this feature’s
implementation. FROH (total run length divided by the
analyzed genomic footprint) is scaled to the footprint actually covered
by the analyzed variants, not the whole genome – a
single-region VCF and a whole-genome VCF give very different
FROH for the same underlying biology, so never compare
FROH values across analyses that covered different genomic
spans.
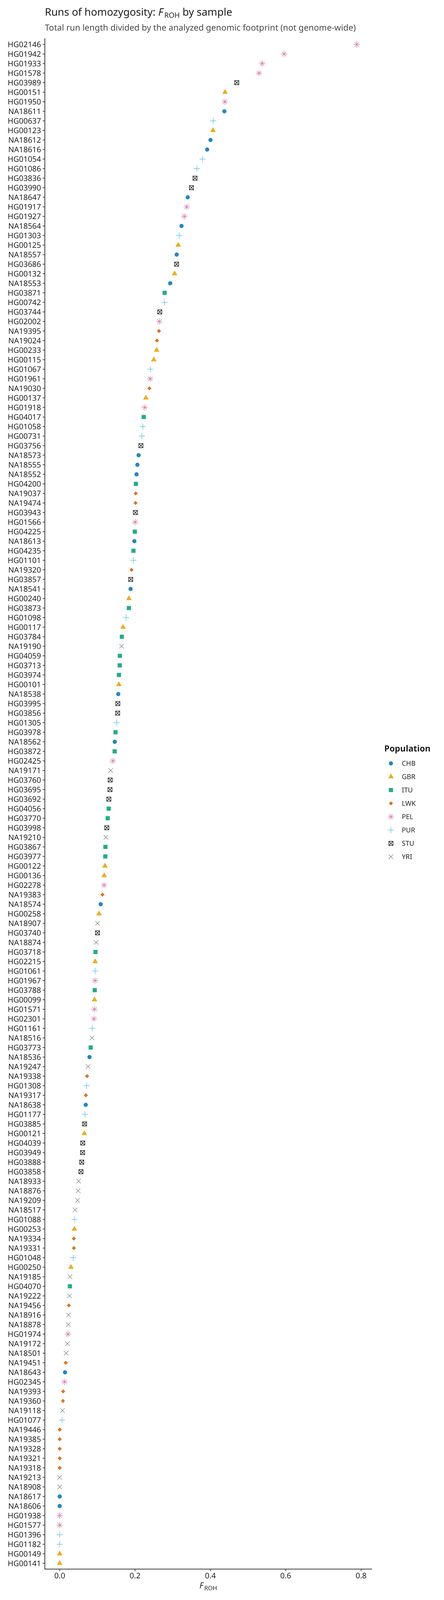
Each run is also classified into a length class (Ceballos et
al. 2018): short (background LD), intermediate (distant common ancestors
via genetic drift), and long (recent close inbreeding), with the two
boundaries configurable
(analyses.roh_length_class_short_max_bp/roh_length_class_long_min_bp,
defaulting to 500 kb and 2 Mb – this package’s own convention chosen
within Ceballos et al.’s published ranges, not a universal standard).
FROH is reported per class as well as in total, on
38_ROH_sample_summary.tsv and the figure below.
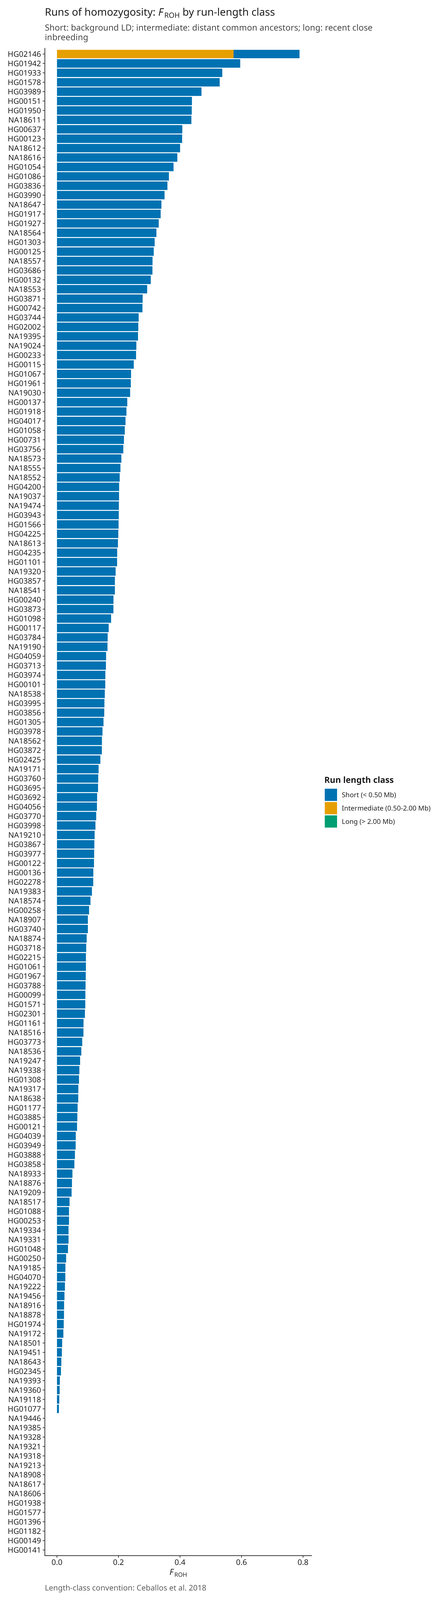
Watch the analyzed genomic footprint against the long-class threshold. In the quickstart example, all 8 populations show zero “long” runs – not because recent close inbreeding is genuinely absent, but because the quickstart’s analyzed chr22 region spans under 1 Mb end to end, smaller than the 2 Mb long-class threshold, so no single run can ever be classified “long” there regardless of true biology. This is a property of the demo’s narrow genomic scope, not a general limitation – a whole-genome VCF is not subject to this ceiling.
Diversity
Allelic richness, heterozygosity, nucleotide diversity, and related summaries are sensitive to sample size, missing data, marker ascertainment, and the genomic regions retained after filtering.
Compare populations only when estimators and sampling effort are appropriate. A lower estimate is not automatically evidence of a bottleneck, inbreeding, or reduced fitness. Those explanations require additional analyses and study-design support.
hwe_pvalue (per-population Wigginton et al. 2005 exact
test) and private_allele are reporting-only and never
filter a SNP. A significant HWE deviation has many non-error causes –
null alleles, genotyping artifacts, selection, non-random mating, or
substructure within the labeled group – and small samples have limited
power to detect real deviations, so treat both the raw and FDR-adjusted
significant-loci counts as descriptive. A private allele is evidence
only that it was observed in one retained population and nowhere else in
the sampled set; it is not, by itself, evidence of adaptive
significance.
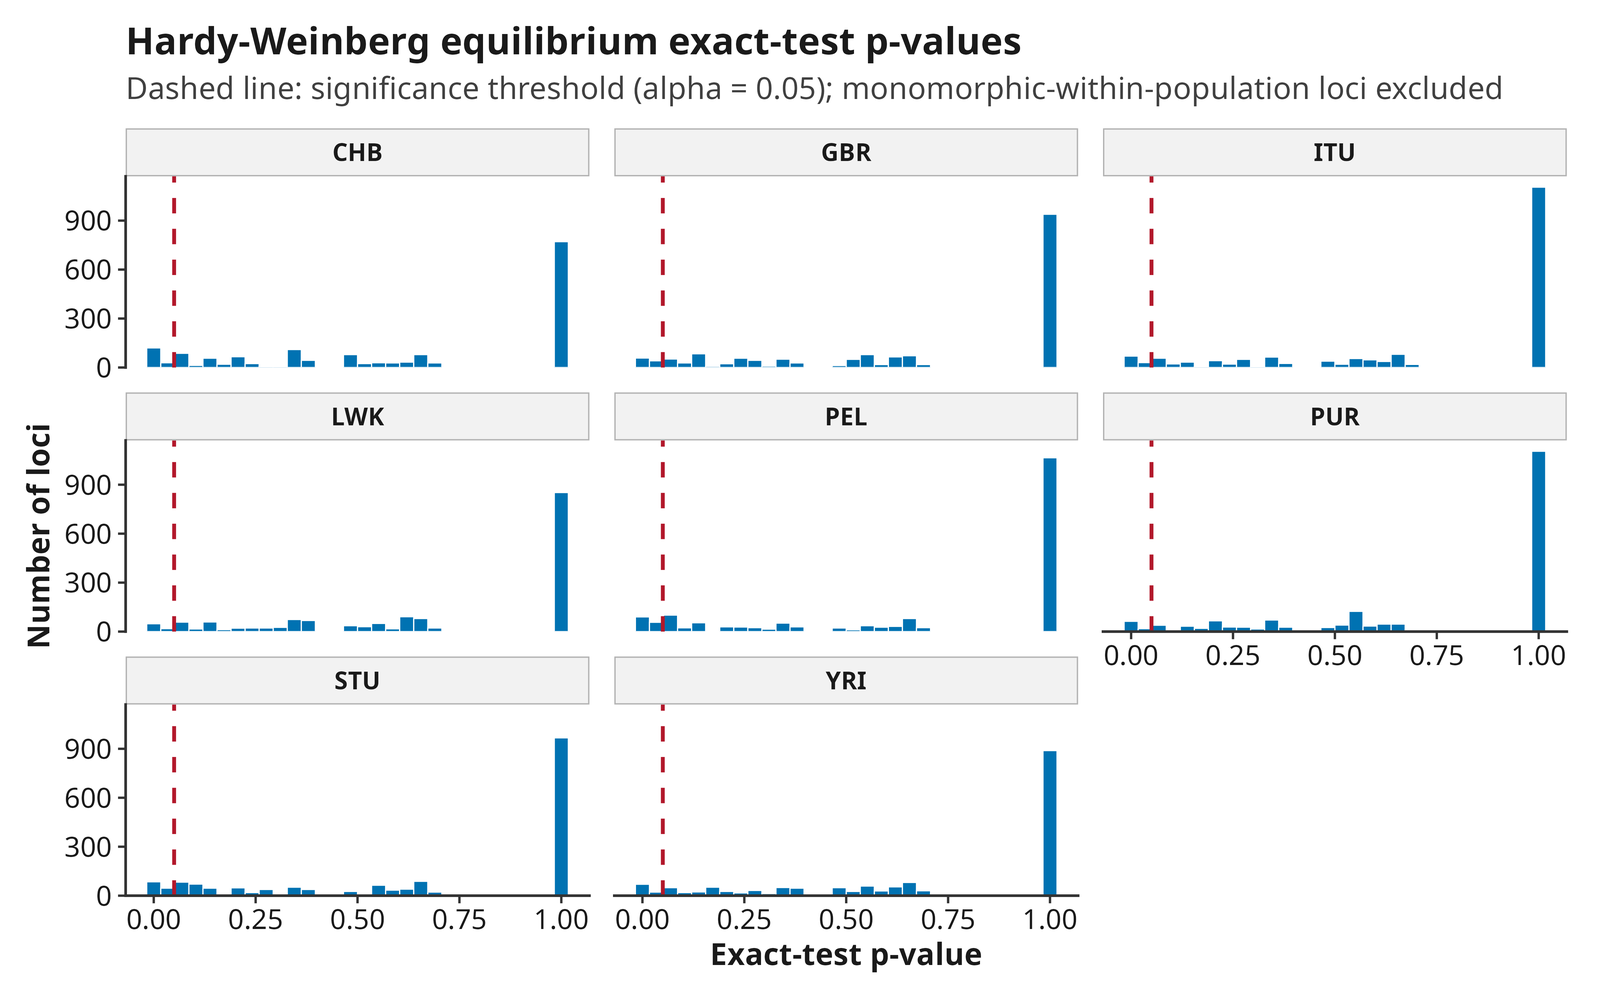
The distribution above is what “descriptive, not exclusionary” looks like in practice: every population shows a large spike at p = 1 (genotype counts matching Hardy-Weinberg expectations exactly, common at biallelic SNP scale) plus a roughly uniform scatter of smaller p-values below the dashed significance threshold – the expected shape under the null, not a red flag by itself. A population with an unusually heavy concentration of loci just below the threshold, rather than this uniform scatter, is the pattern worth investigating further.
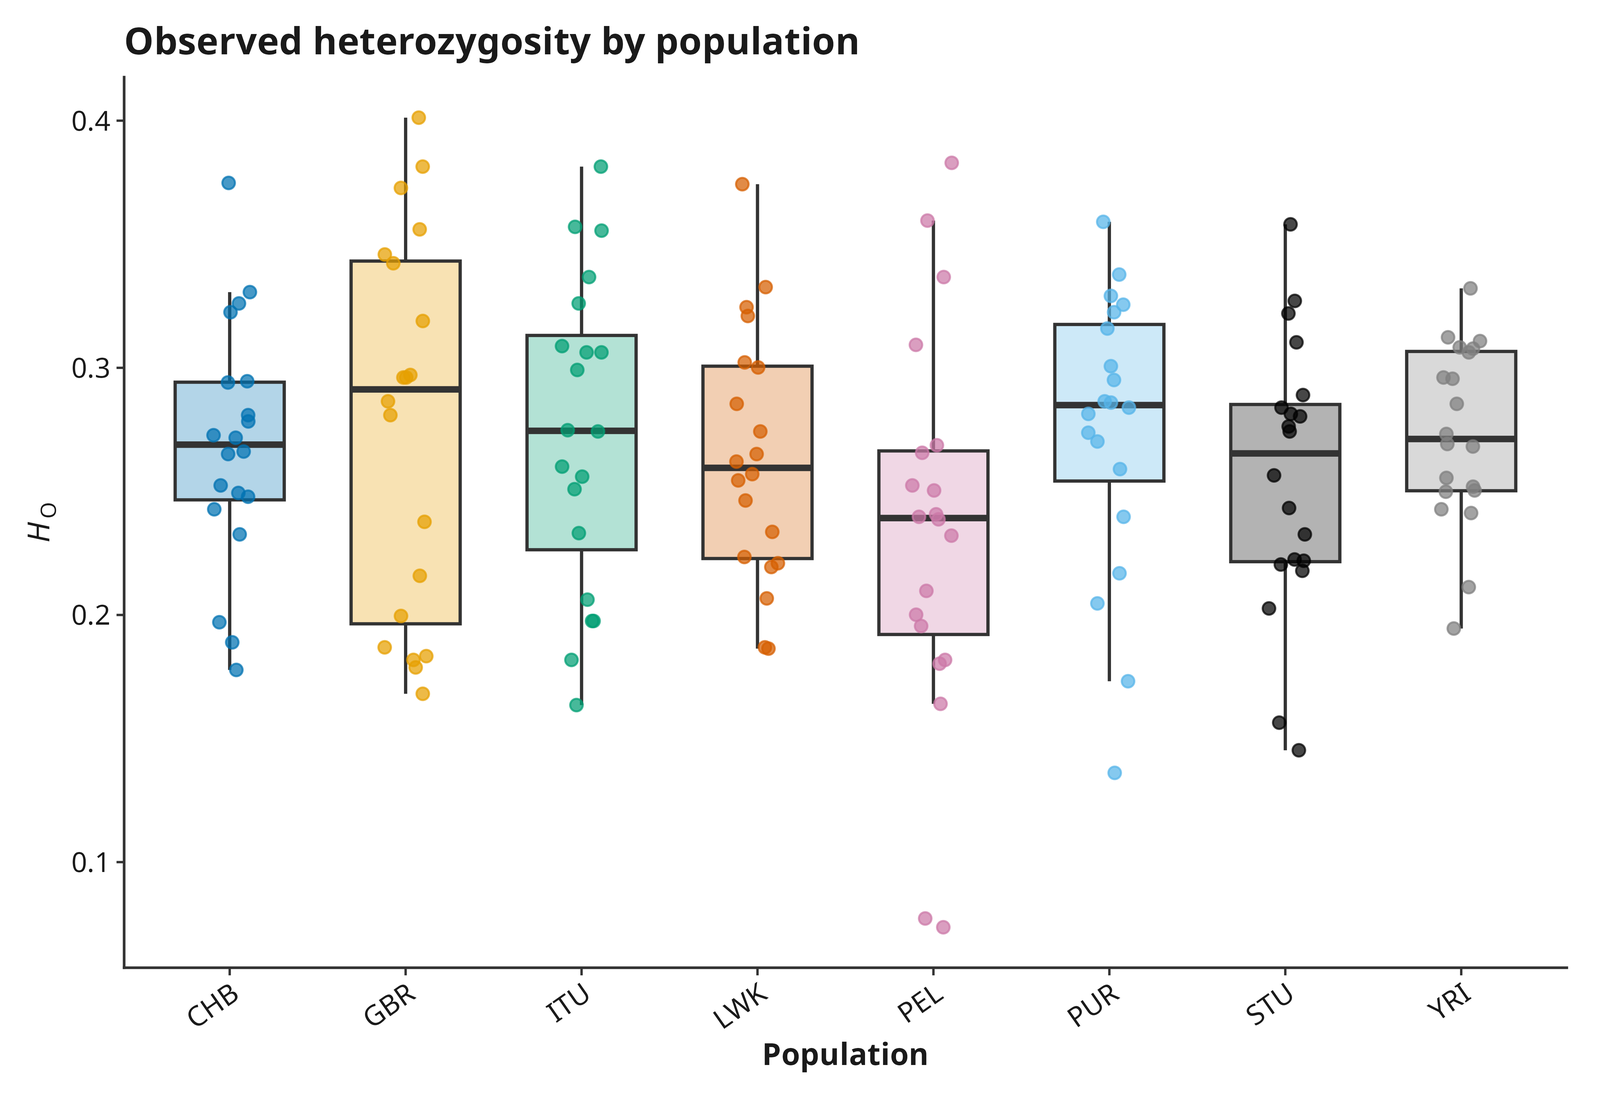
The sample-level view above complements a population-level one: observed heterozygosity averaged per population against its Hardy-Weinberg expectation.
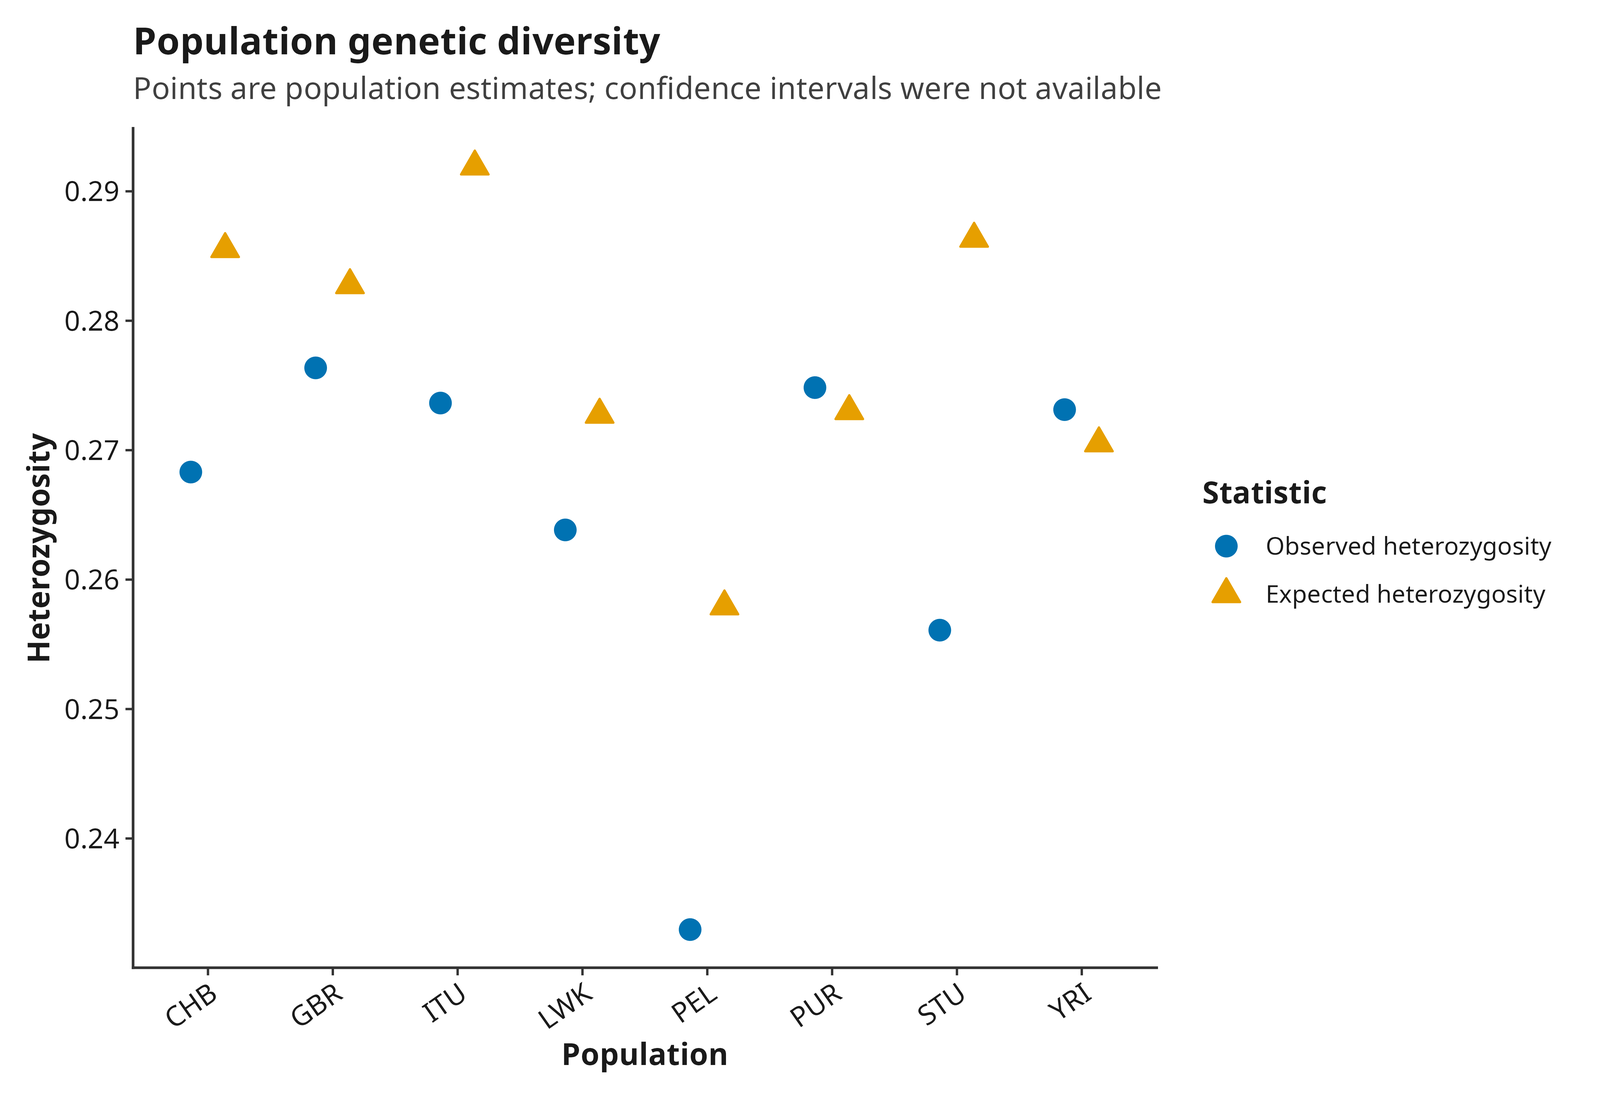
A population whose observed heterozygosity sits well below its expected value (PEL here, a real 1000 Genomes admixed American population) is worth a second look with FIS/inbreeding-aware analyses – this comparison alone does not distinguish inbreeding, a Wahlund effect (pooling genetically distinct sub-groups under one population label), or a complex admixed demographic history from each other.
allelic_richness (rarefied via
hierfstat::allelic.richness(), an optional dependency that
skips transparently with a logged warning if not installed) is a
per-population, sample-size-corrected count of alleles per locus –
unlike raw heterozygosity, it is comparable across populations with
unequal sample sizes, since it rarefies every population down to the
same allele count before counting. For biallelic SNPs it ranges from 1
(monomorphic within the population) to 2 (both alleles present).
Rarefaction depth is set by the smallest population, so populations with
fewer than 5 samples are left out of the calculation (their
allelic_richness is NA, with a pipeline
notice) rather than dragging every population down to their size – one
singleton population would otherwise rarefy the whole table to 2 gene
copies, where richness is just 1 + He. If fewer than two populations
reach 5 samples, all are kept.
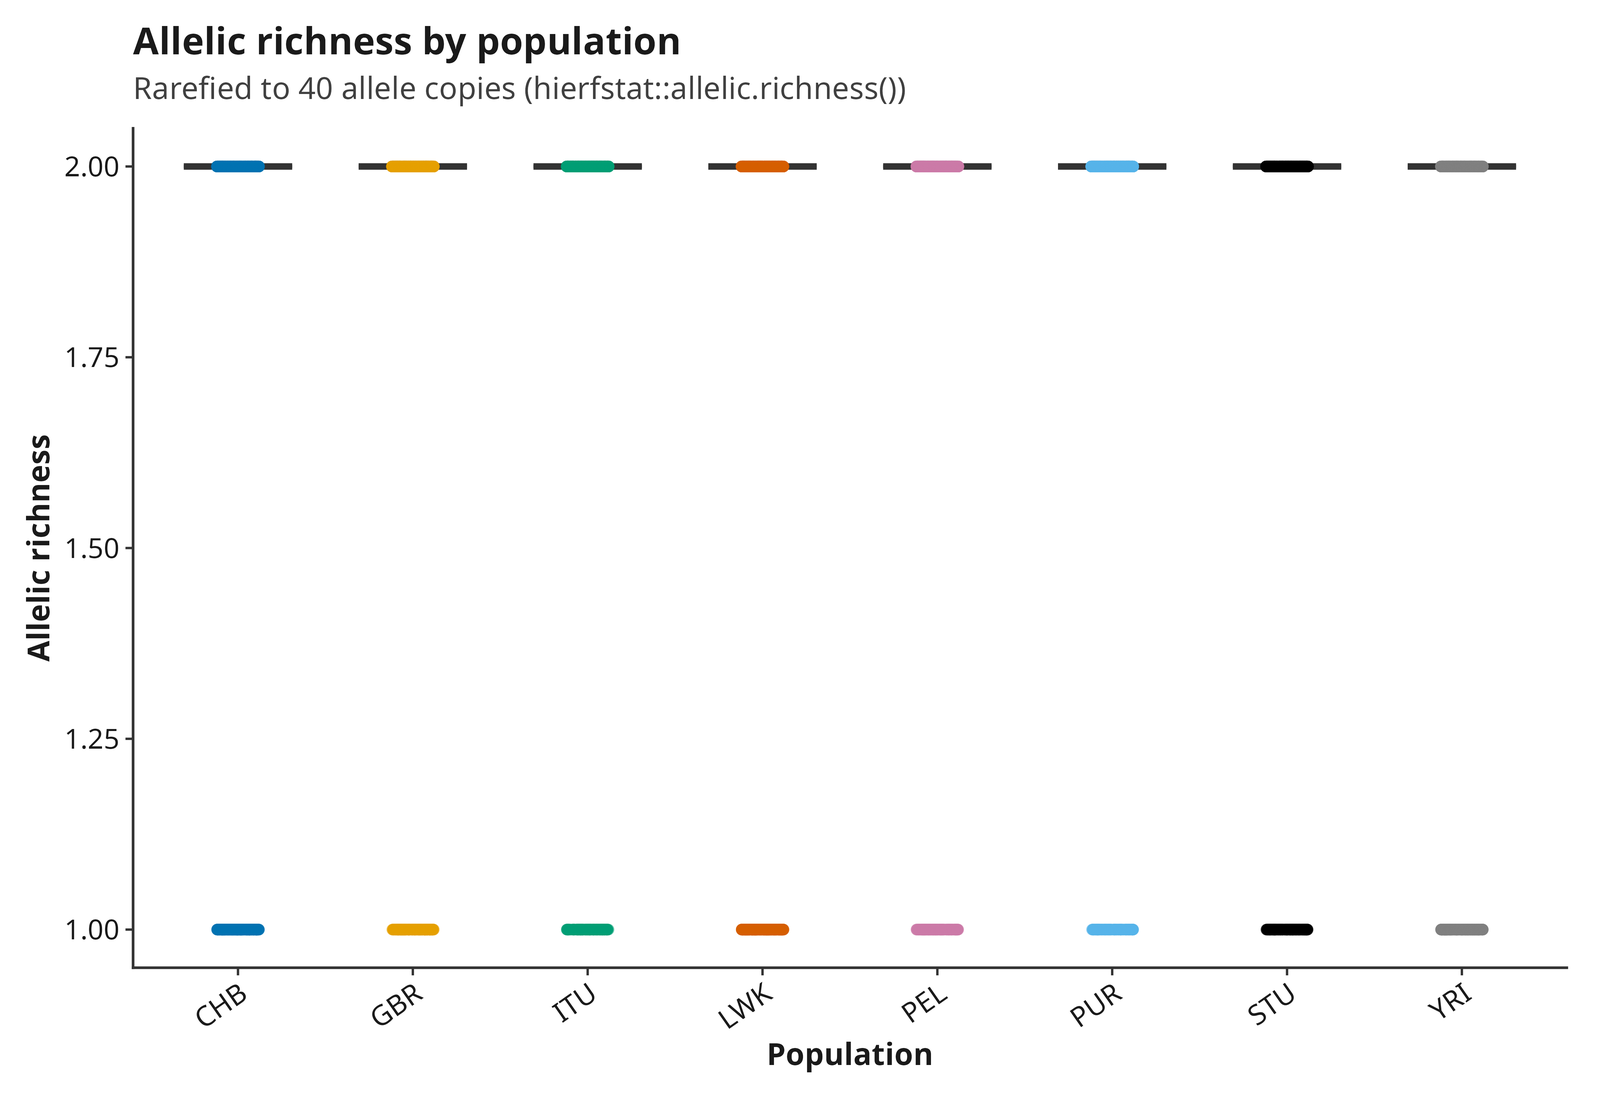
The quickstart example’s 8 populations are all exactly 20 samples, so richness is rarefied to 40 allele copies and unsurprisingly narrow (1.82 to 1.94 across populations) – this metric earns its keep on real datasets with unbalanced population sizes, where it can diverge from raw heterozygosity in ways worth investigating.
effective_alleles (Kimura and Crow 1964, Ae = 1 / (1 -
unbiased expected heterozygosity)) complements allelic richness;
mean_effective_alleles averages the per-locus values (not
the same as computing Ae from the mean heterozygosity). Unlike rarefied
allelic richness, Ae is not bounded above at 2 for biallelic markers –
it is a bias-corrected continuous estimator, and small samples can
legitimately push it above 2 or to infinity (Inf, not a
fabricated value, the same convention as Nm and Ne(LD)). On the
quickstart example, mean_effective_alleles ranges from 1.44
to 1.51 across the 8 populations.
inbreeding_coefficient (FIS, 1 - mean observed
heterozygosity / mean expected heterozygosity per population) summarizes
the observed-vs-expected gap referenced above in one number; positive
values flag the same heterozygote deficit and share its ambiguity –
inbreeding, a Wahlund effect, and technical artifacts all raise it.
Site frequency spectrum and bottleneck screen
48_site_frequency_spectrum.tsv bins each population’s
segregating loci by folded minor allele frequency.
49_bottleneck_mode_shift.tsv applies the mode-shift test
(Luikart and Cornuet 1998): under mutation-drift equilibrium the lowest
frequency class should hold the most loci; a mode shifted to a higher
class is a possible recent-bottleneck signature. This is a qualitative
screen, not a p-value or a confirmed bottleneck, and (unlike the classic
heterozygosity-excess test) makes no assumption about the locus mutation
model. The call is withheld (mode_shifted = NA,
mode_shift_status = "too_few_samples") for a population
with fewer called samples than frequency classes (10 by default): the
smallest attainable MAF is 1/(2n), so below that size the lowest class
cannot hold a single locus and the mode can never fall in it. Luikart
and Cornuet recommend about 30 individuals; treat a call from 10-30
samples as weak.
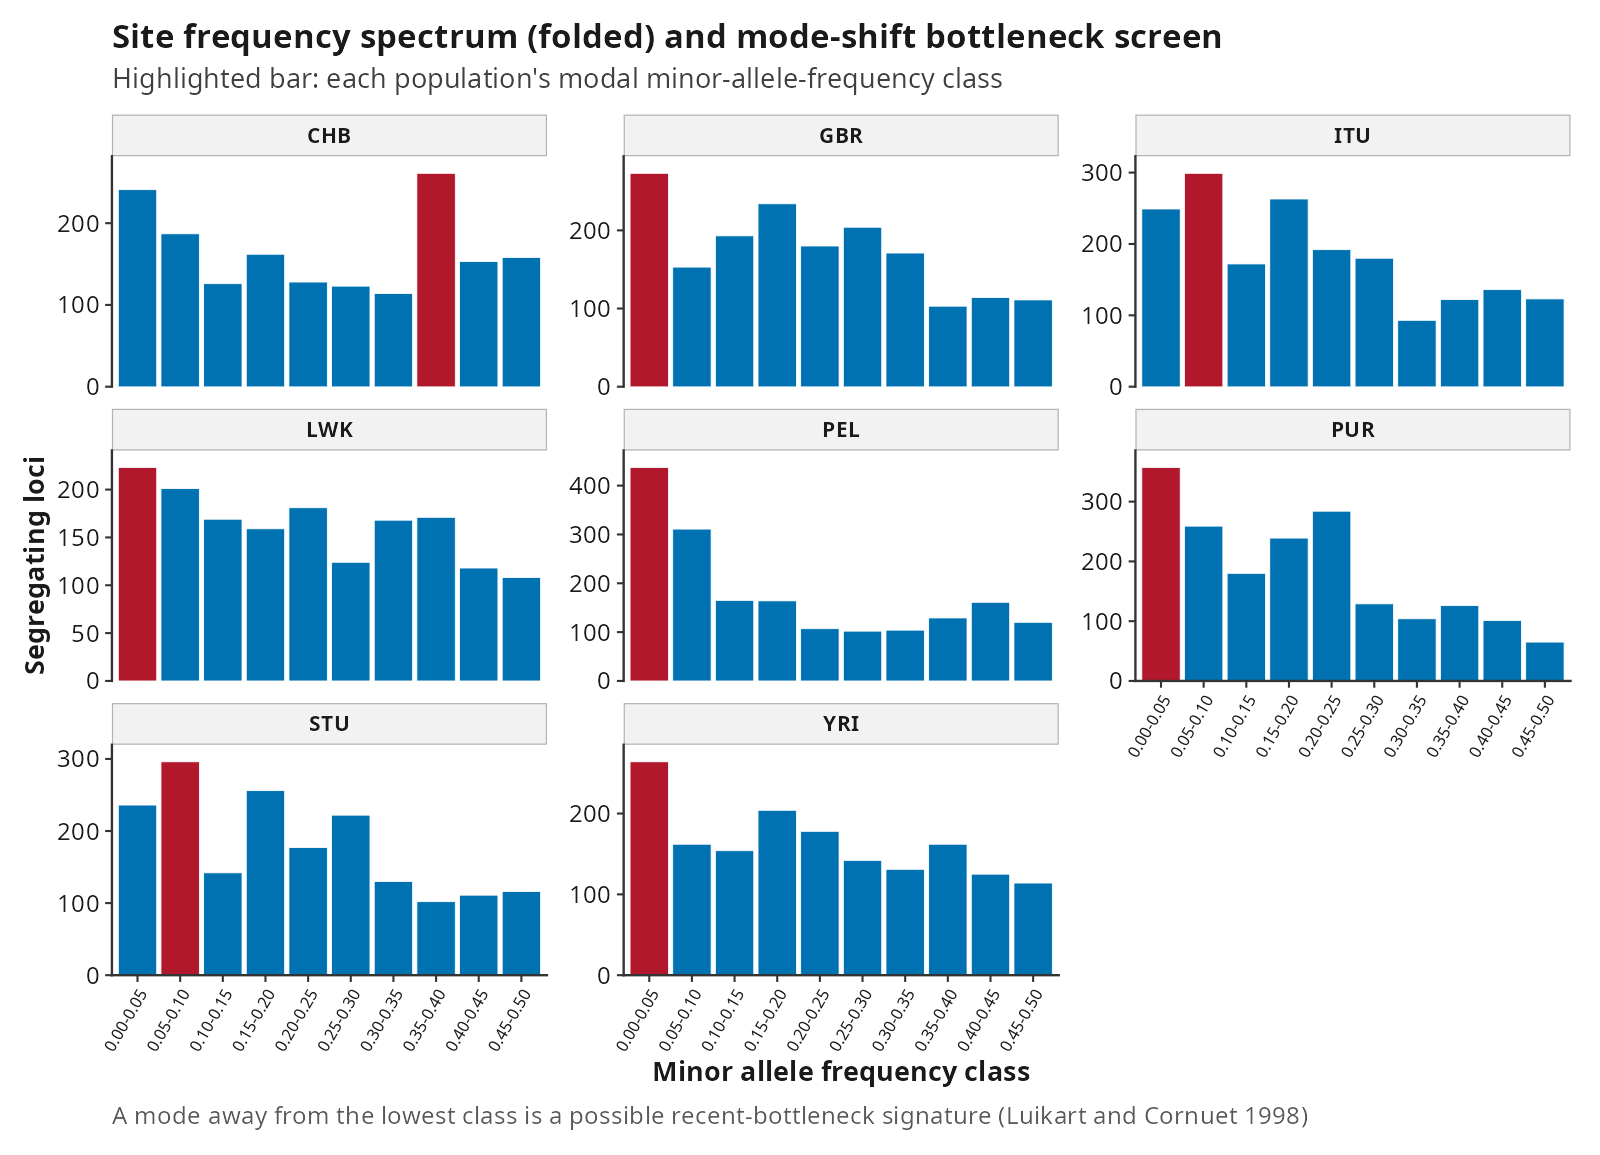
Read this with the same caution as any MAF-filtered analysis: with
the default qc.maf = 0.05 filter, 3 of the 8 quickstart
populations (CHB, ITU, STU) show mode_shifted = TRUE, but
re-running with qc.maf = 0 on the same data shows none of
the 8 is mode-shifted – every population has the expected lowest-class
mode once the filter is removed. The default MAF filter removes
population-rare variants before this test runs, which alone can produce
a spurious mode-shift signal (the same caveat already documented for
Tajima’s D). This is not evidence that those 3 populations experienced a
recent bottleneck. (Releases before 1.0.15 reported all 8 as shifted: a
floating-point binning error placed every MAF sitting exactly on a class
boundary one class too high.)
FST
FST summarizes relative allele-frequency differentiation under a specified estimator. It is not a direct measure of migration rate, divergence time, or reproductive isolation.
Report the estimator, marker set, population definitions, sample
sizes, confidence intervals or resampling procedure, and whether
pairwise estimates are stable. Negative estimates can arise from
sampling variation and should be handled according to the documented
estimator policy rather than silently transformed.
20_pairwise_FST_bootstrap_CI.tsv provides that uncertainty
directly, as 95% bootstrap intervals from resampling whole chromosomes
as blocks (analyses.bootstrap, 500 replicates by default).
Block resampling respects within-chromosome LD, but it also means a
single-chromosome dataset (like this quickstart example) produces no CI
at all, and a genome with only a few chromosomes gives coarse, unstable
intervals – check the replicates column and the number of
contributing chromosomes before quoting an interval. The same applies to
11_diversity_bootstrap_CI.tsv for the diversity summaries
above.
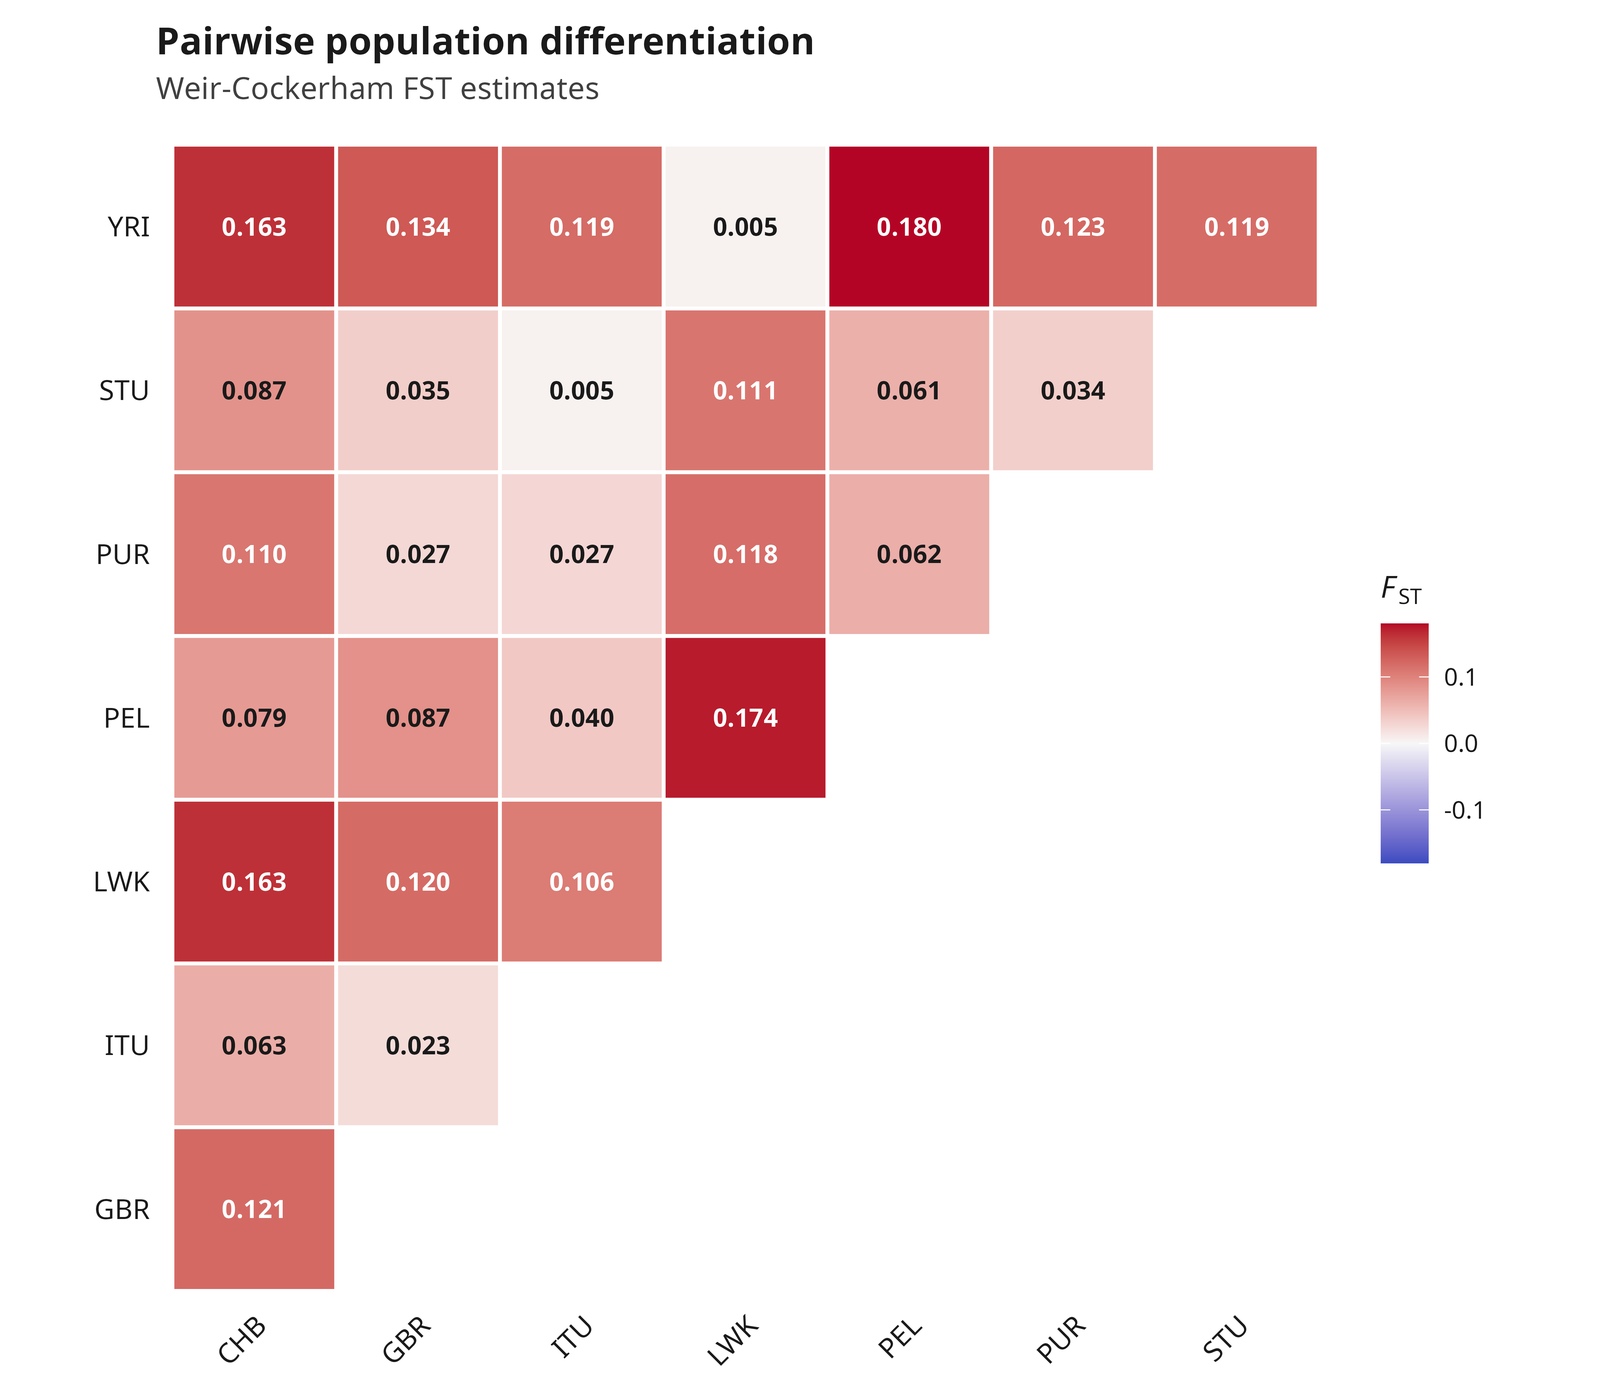
The global FST estimate for the quickstart example is 0.0915, consistent with real, moderate differentiation across 8 geographically diverse populations at this marker density.
Every FST estimate is accompanied by Wright’s (1931) island-model
gene-flow estimate, Nm = (1 - FST) / (4 * FST), on
17_global_FST.tsv (global_nm) and
18_pairwise_FST.tsv (nm) – a direct, monotonic
transform of the same FST value, not shown as a separate figure. On the
quickstart example, global Nm = 2.48; the pairwise minimum (ITU-STU, FST
= 0.0052) gives Nm = 48.3 and the pairwise maximum (PEL-YRI, FST =
0.180) gives Nm = 1.14. Treat Nm as a rescaled FST for readers who think
in island-model units, not as a measured number of migrants per
generation: the formula assumes an equilibrium island model (equal deme
sizes, symmetric migration, no selection) that real populations violate,
and Nm inherits every ascertainment and sampling caveat of the FST it
was derived from (Whitlock and McCue 1999).
The same tables also carry Jost’s (2008) D
(global_jost_d, jost_d on
18_pairwise_FST.tsv, and
19b_pairwise_jost_d_matrix.tsv) – a different
differentiation measure, not a transform of FST. FST’s denominator is
bounded by within-population heterozygosity, so a highly polymorphic
marker set can never show a high FST even under strong true
differentiation; Jost’s D avoids that constraint. On the quickstart
example, global Jost’s D = 0.0387 versus global FST = 0.0915 (expected –
Jost’s D is typically smaller than FST). Pairwise D correlates strongly
with FST (r = 0.998) but reverses the order of the two closest,
near-tied population pairs (ITU-STU vs. LWK-YRI) – the two measures
agree overall without being interchangeable in fine detail.
The same tables also carry Nei’s (1987) Dxy, absolute nucleotide
divergence (global_dxy, dxy on
18_pairwise_FST.tsv, and
19c_pairwise_dxy_matrix.tsv) – a third differentiation
measure, and the one genuinely unnormalized member of the group. Dxy
here is averaged over the analyzed segregating SNPs only, not per base
pair of sequence – literature Dxy values (typically ~0.001/bp for
humans) include invariant sites and are not comparable to this number,
and MAF filtering raises it further. Like FROH, never compare Dxy across
analyses with different marker sets or filters; use it only to rank
pairs within this one run. global_dxy is simply the mean of
the pairwise matrix, not a separate multi-population estimator. FST, Nm,
and Jost’s D are all scaled by within-population diversity, so identical
low values can mask two different demographic histories: recent
divergence with ongoing gene flow (low Dxy) versus an older split that
still shares a lot of ancestral polymorphism (high Dxy), a distinction
FST alone cannot make (Cruickshank and Hahn 2014). On the quickstart
example, global Dxy = 0.3056; pairwise Dxy correlates positively with
FST (r = 0.90) but noticeably less tightly than Jost’s D does (r =
0.998) – expected, since Dxy is not scaled by within-population
heterozygosity. Read honestly: in this dataset the two lowest-FST pairs
(ITU-STU and LWK-YRI) are also the two lowest-Dxy pairs, so no FST/Dxy
decoupling shows up here, consistent with these 8 populations sharing a
broadly similar, relatively recent divergence history rather than the
more variable species-level divergence times where FST/Dxy decoupling is
most often reported.
Global and pairwise FST both describe the whole dataset or a pair of
populations; neither directly answers “how distinct is this one
population from the panel as a whole.” Population-specific FST / beta
(Weir and Goudet 2017), via hierfstat::betas() (the
reference implementation), fills that gap: a per-population value using
a common (“global”) kinship reference rather than a pairwise one, on
51_population_specific_fst.tsv.
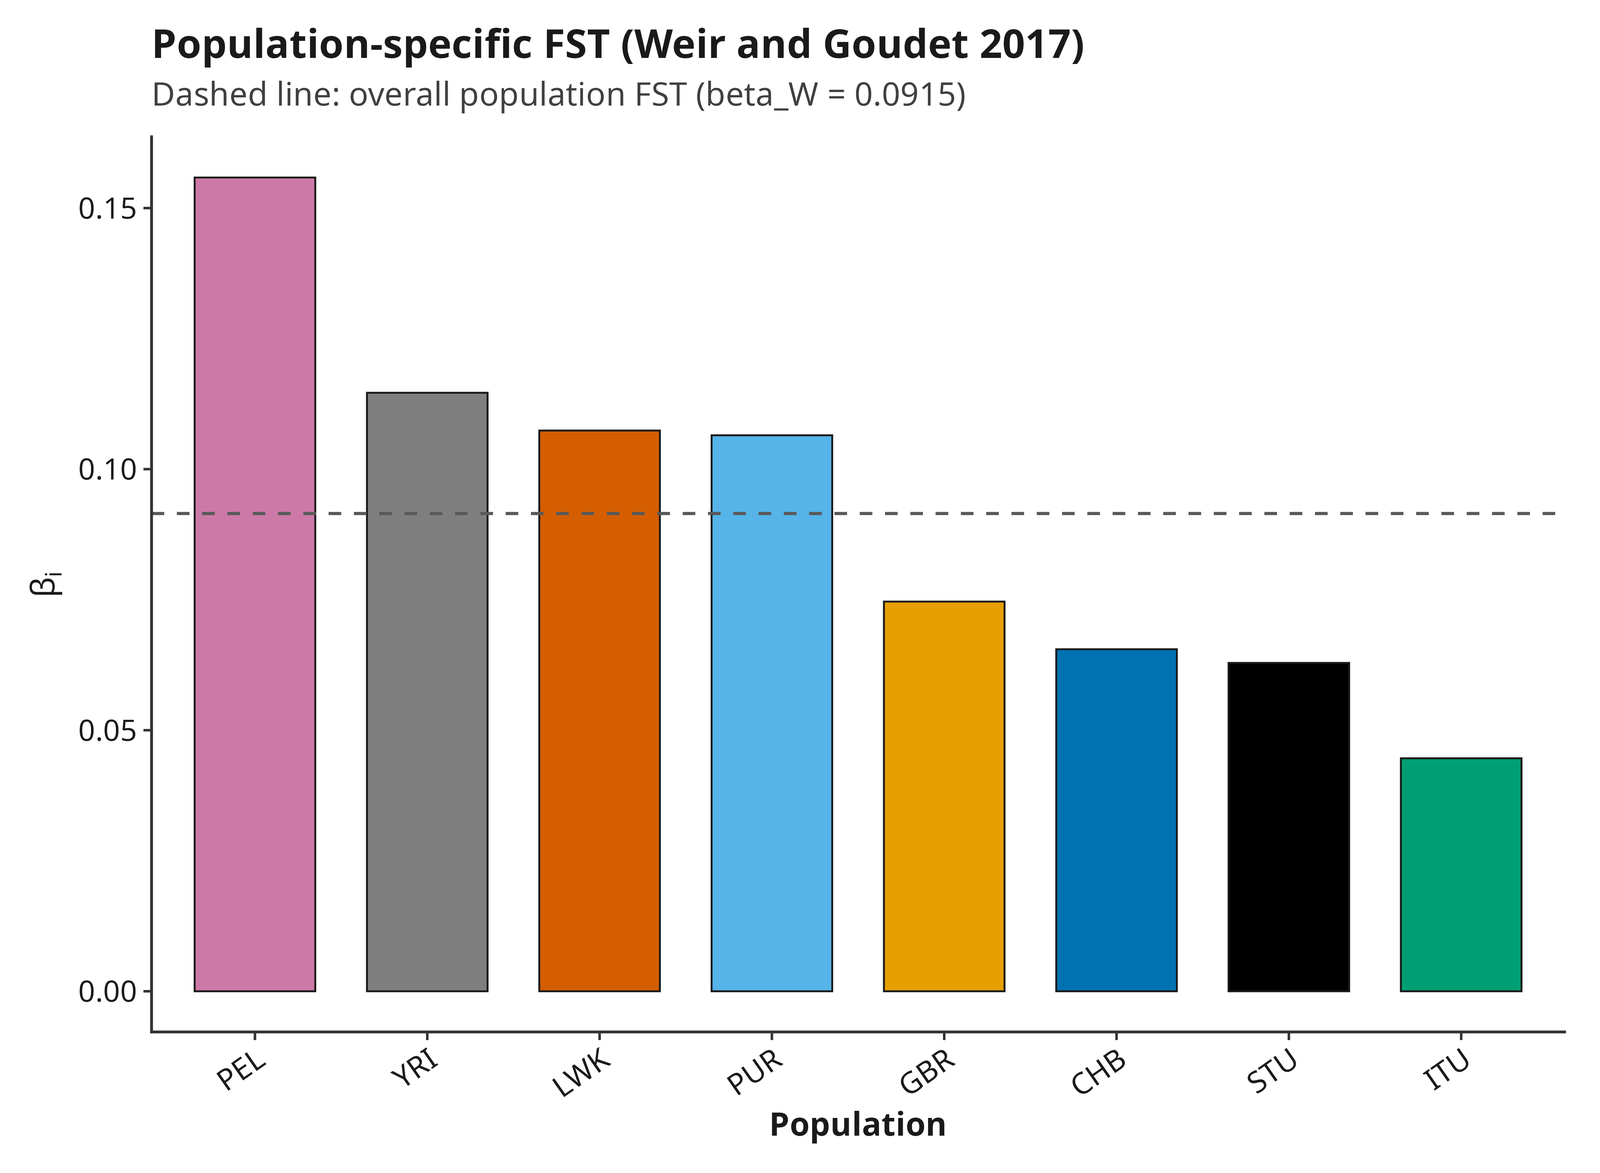
On the quickstart example, the overall weighted mean
(global_beta_fst) is 0.0915 – agreeing with
global_fst to 9 significant figures here, an
internal-consistency check that holds this exactly because every
population in the quickstart has the same sample size. Weir-Cockerham
theta and Weir-Goudet beta are different estimators; with unequal sample
sizes or missingness they weight populations differently and can
legitimately diverge – a modest difference on your own data is not an
error. Per-population beta ranges from ITU (0.0446, least distinct from
the rest of the panel) to PEL (0.1558, most distinct); PEL standing out
as the most differentiated population matches this package’s own
Nei’s-distance and population-assignment results elsewhere in this
report, an independent third confirmation of the same real
population-structure pattern.
Per-chromosome summaries
analyses.chromosome_specific (on by default) re-runs
global FST and a short (up to 3-PC) PCA independently on each
chromosome/contig, writing one row per chromosome to
chromosome_summary.tsv (qc_snps,
ld_snps, global_fst, pc1_percent)
plus a full pairwise-FST table and PCA scores table per chromosome under
the chromosomes/ output directory. A chromosome
contributing fewer than analyses.chromosome_min_snps (100
by default) QC-passing SNPs, or fewer than 2 LD-pruned SNPs, is silently
excluded from the summary – a short contig or an unplaced scaffold
missing from chromosome_summary.tsv is expected, not a
bug.
Read this table as a heterogeneity check, not a second, independent
analysis: one chromosome’s global_fst or
pc1_percent standing out from the rest is first a
marker-density or chromosome-length question (fewer SNPs give noisier
per-chromosome estimates) and only then a biology question (a sex
chromosome, an inversion, or a region under strong local selection).
Compare the standout chromosome’s
qc_snps/ld_snps counts against the others
before reading anything biological into it.
Population genetic distance and tree
46_population_genetic_distance.tsv is Nei’s (1972)
standard genetic distance between populations, computed from allele
frequencies – a different deliverable from kinship/the individual tree
above: those describe relationships among samples, this
describes relationships among populations. A
neighbour-joining tree built from this distance matrix is written to
trees/population_Nei_neighbor_joining.nwk and rendered as a
figure whenever at least three populations are present, with the same
locus-resampling bootstrap support (Felsenstein 1985; see the individual
IBS tree above for what the percentages mean) shown at each internal
node.
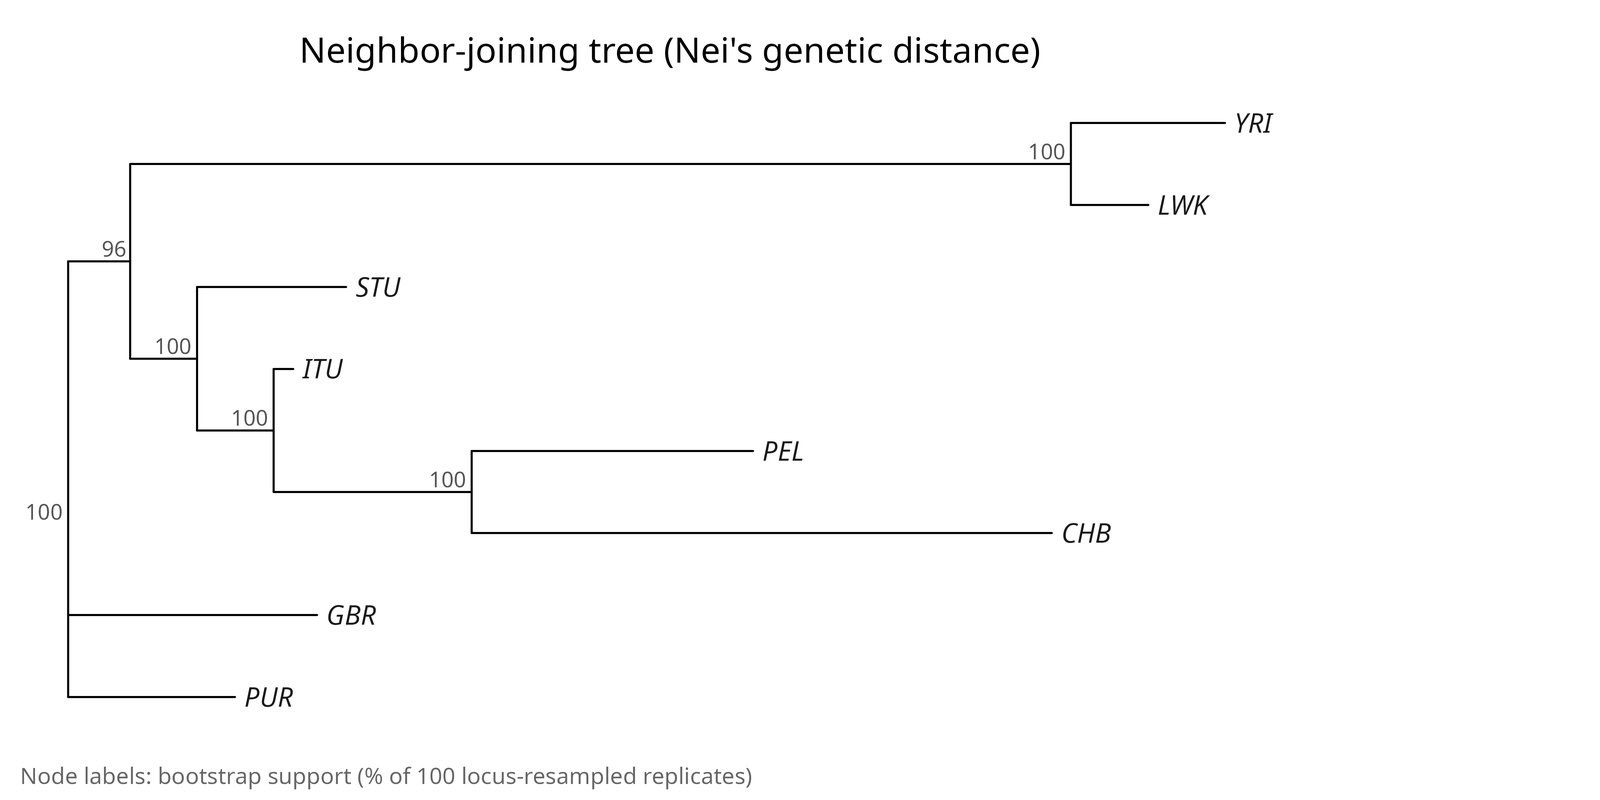
On the quickstart example, LWK-YRI (Luhya, Kenya and Yoruba, Nigeria, both African) is the single closest pair (D=0.0112), while the largest distances are all African-vs-non-African population pairs (up to D=0.091) – the expected continental-population-structure pattern, a real result from real chr22 data. Unlike the individual-level tree above, support here is uniformly high (96-100% at every internal node): population-level allele-frequency distances average over many individuals per population, making the resulting topology far more robust to which specific loci were sampled than any single individual-level split can be.
Population assignment test
47_population_assignment.tsv is a frequency-based
self-assignment test (Paetkau et al. 1995, 2004): for each sample, the
leave-one-out likelihood (Rannala and Mountain 1997) of its genotype is
computed under every population’s allele frequencies, and the sample is
assigned to whichever population maximizes that likelihood. A sample
whose assigned population differs from its recorded metadata label
(mismatch = TRUE) is a candidate migrant or a metadata
error. Uses the same LD-pruned marker set as kinship/PCA/IBS, since the
per-locus likelihoods are multiplied together assuming independence
across loci.
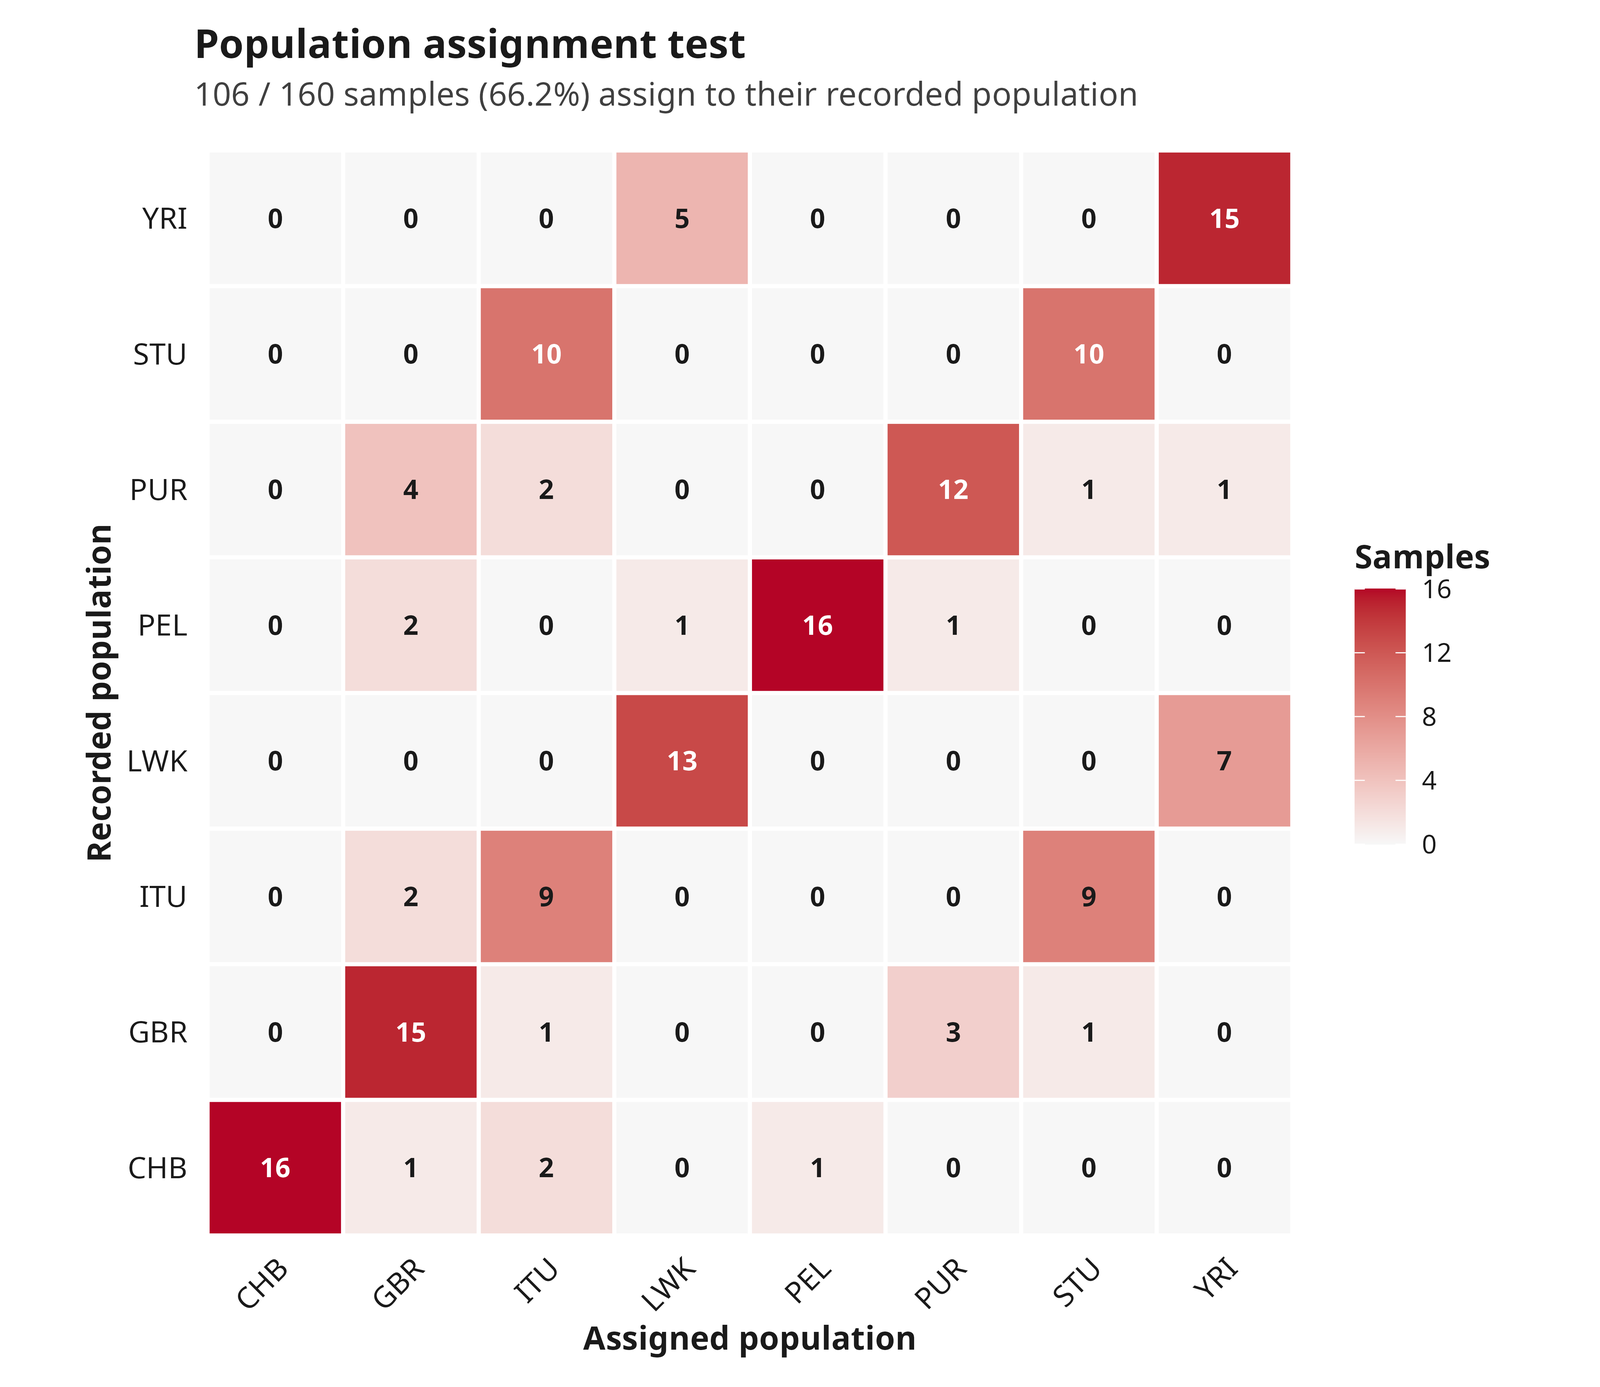
On the quickstart example, 106 of 160 samples (66%) correctly self-assign. The 54 mismatches are heavily concentrated in the two most genetically similar population pairs already identified above by FST/Nm: 31 of 54 (57%) are ITU/STU or LWK/YRI cross-assignments – an independent cross-validation of the FST/Nm and Nei’s-distance results, using a per-sample genotype-likelihood approach rather than aggregate allele-frequency distance, not a defect in the method.
Genome scans
Windowed FST and diversity (39_genome_scan_fst.tsv,
40_genome_scan_diversity.tsv) track the same statistics
above along physical position rather than only as a single genome-wide
number – useful for spotting localized differentiation or diversity
outliers. Windows are non-overlapping by default
(analyses.genome_scan_step_bp equals
analyses.genome_scan_window_bp); a smaller step gives a
real overlapping/sliding scan.
41_genome_scan_FST_outliers.tsv is a descriptive ranking
(highest-FST windows), not a significance test – no
permutation or null distribution is computed, so a high-FST window is a
candidate worth further investigation, not a statistically confirmed
selection signal. Always check a window’s n_snps before
treating its estimate as meaningful: windows below
analyses.genome_scan_min_snps (default 5) are reported as
NA rather than a misleadingly precise value from too few
markers, and even windows just above that threshold can be noisy.
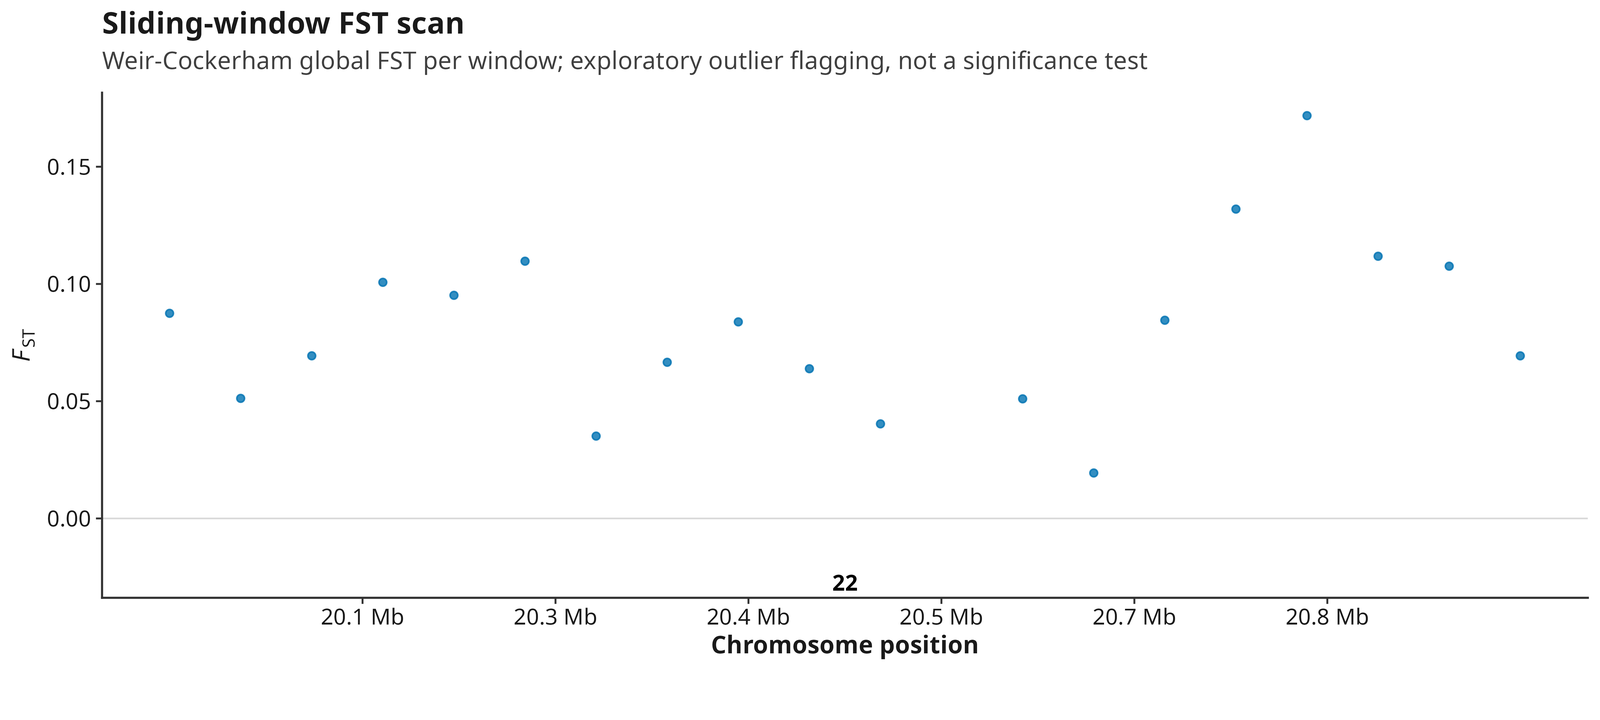
Of the 20 windows, 19 hold enough SNPs to estimate (one holds none) and range from FST 0.019 to 0.172. The single highest, 20.80-20.85 Mb (FST=0.172, 104 SNPs), is a candidate worth further investigation under the caveats above, not a confirmed selection signal – especially since it is only moderately above the region’s known global FST of 0.0915.
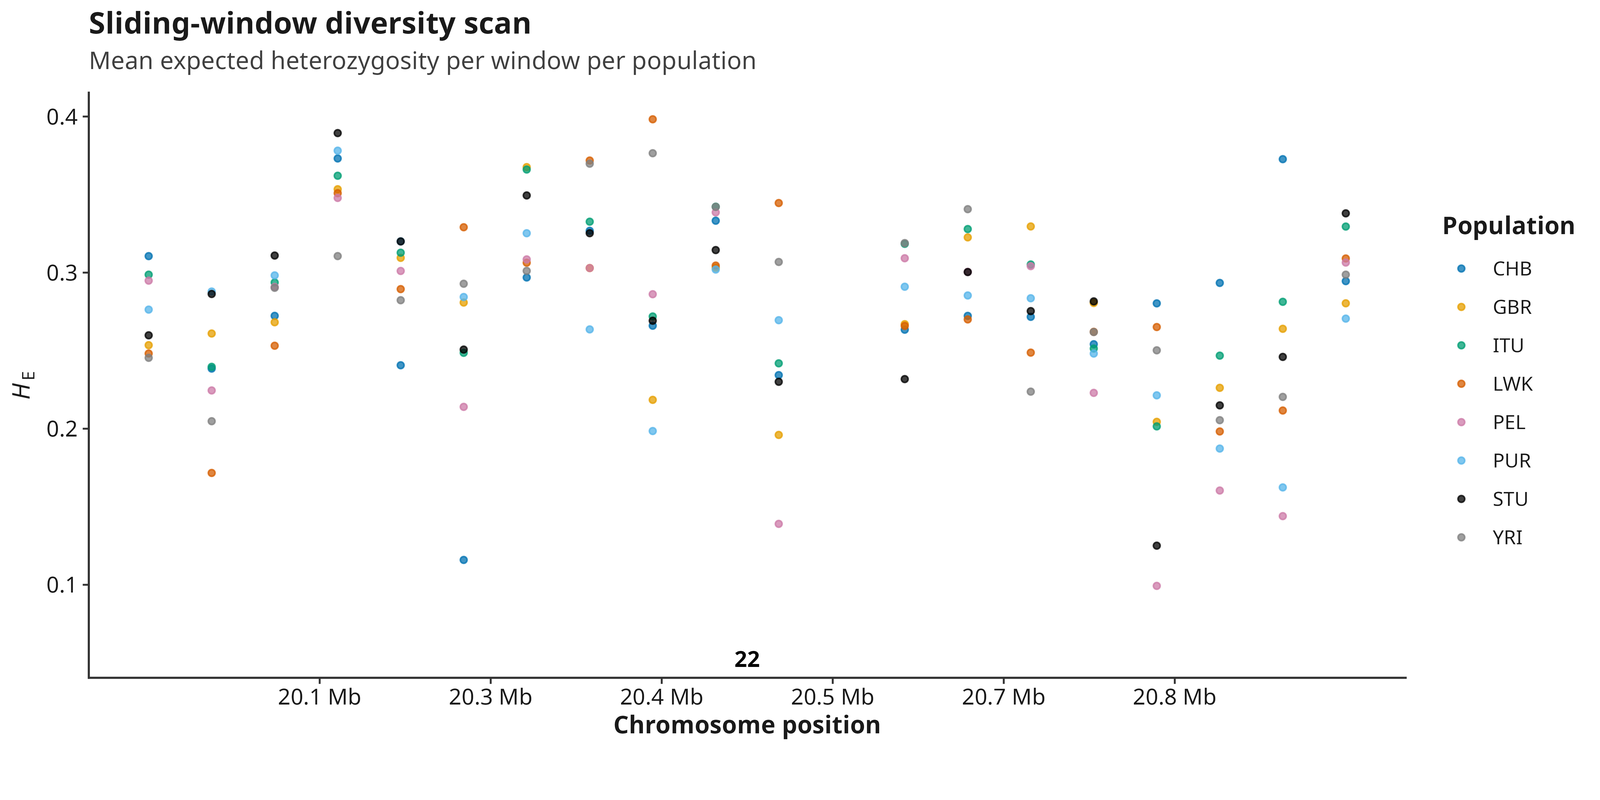
Mean expected heterozygosity per window per population ranges from 0.099 to 0.398 across the 8 populations – the same kind of real, biologically plausible spread reported for the genome-wide diversity summary above, now resolved by position.
segregating_sites/tajima_d (Tajima 1989)
are also computed per window per population, reusing the same window
grid and locus data – windowed Watterson’s theta vs. pairwise nucleotide
diversity, a classical neutrality-test statistic (positive: excess of
intermediate-frequency variants relative to neutral expectation;
negative: excess of rare variants, e.g. after a selective sweep or
population expansion). Like the FST outliers above, a single window’s
Tajima’s D is descriptive, not itself a significance test.
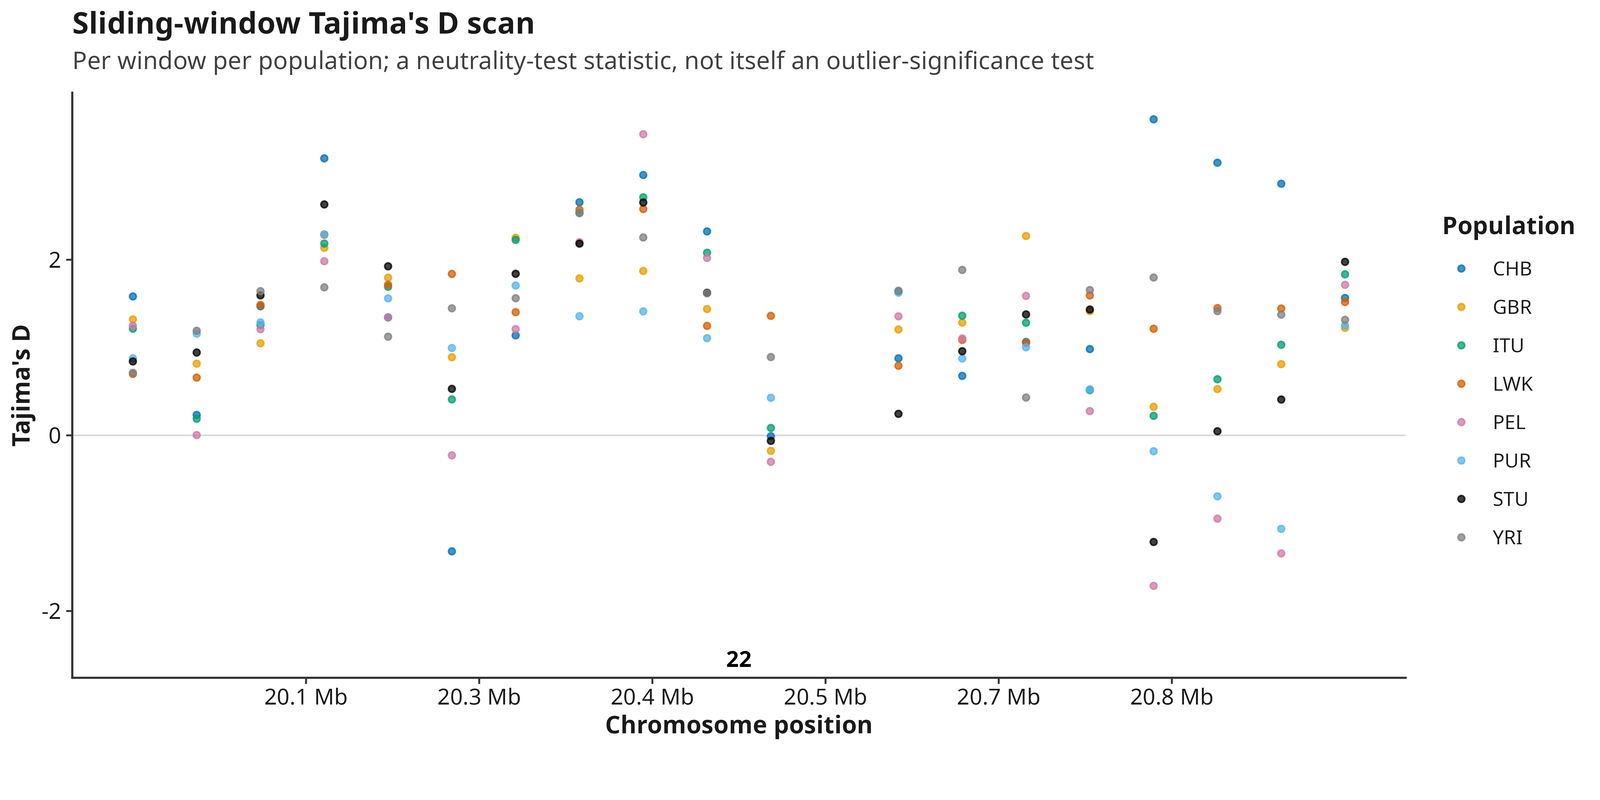
Real values are almost entirely positive (median 1.34, range -1.71 to
3.60 across the 152 windows with a defined estimate). This is an
expected artifact of this pipeline’s own QC, not necessarily a real
signal of balancing selection or population contraction: the default
minor-allele-frequency filter (qc.maf, default 0.05)
removes rare variants before this scan runs, and removing rare
variants is well known to bias Tajima’s D upward (it reduces the
segregating-sites count much more than it reduces pairwise diversity).
Interpreting Tajima’s D values from any MAF-filtered marker set – the
norm for SNP-array/exome-chip data, including this one – needs this
caveat kept in mind.
pcadapt outlier scan
59_pcadapt_outliers.tsv is a genuine per-locus
statistical outlier test for local adaptation/selection (Luu et
al. 2016; Privé et al. 2020), via the pcadapt package –
distinct from the genome-scan FST-outlier table above, which is
descriptive, not a significance test. PCA is fit on the retained
genotype matrix; each locus’s genotypes are regressed on the K retained
PC scores to get a vector of z-scores, and a robust,
genomic-control-corrected Mahalanobis distance of that vector is tested
against a chi-squared distribution with K degrees of freedom, giving a
real p-value per locus. Benjamini-Hochberg FDR correction controls the
false-discovery rate; 59b_pcadapt_significant_outliers.tsv
lists loci significant at analyses.pcadapt_fdr_alpha
(default q < 0.05). Unlike almost every other module in this report,
pcadapt does not require population metadata at all. K
defaults to (number of populations - 1) when available, falling back to
pcadapt’s own default of 2 otherwise. Computed on the full QC-passing,
unpruned marker set, like the genome scans above.
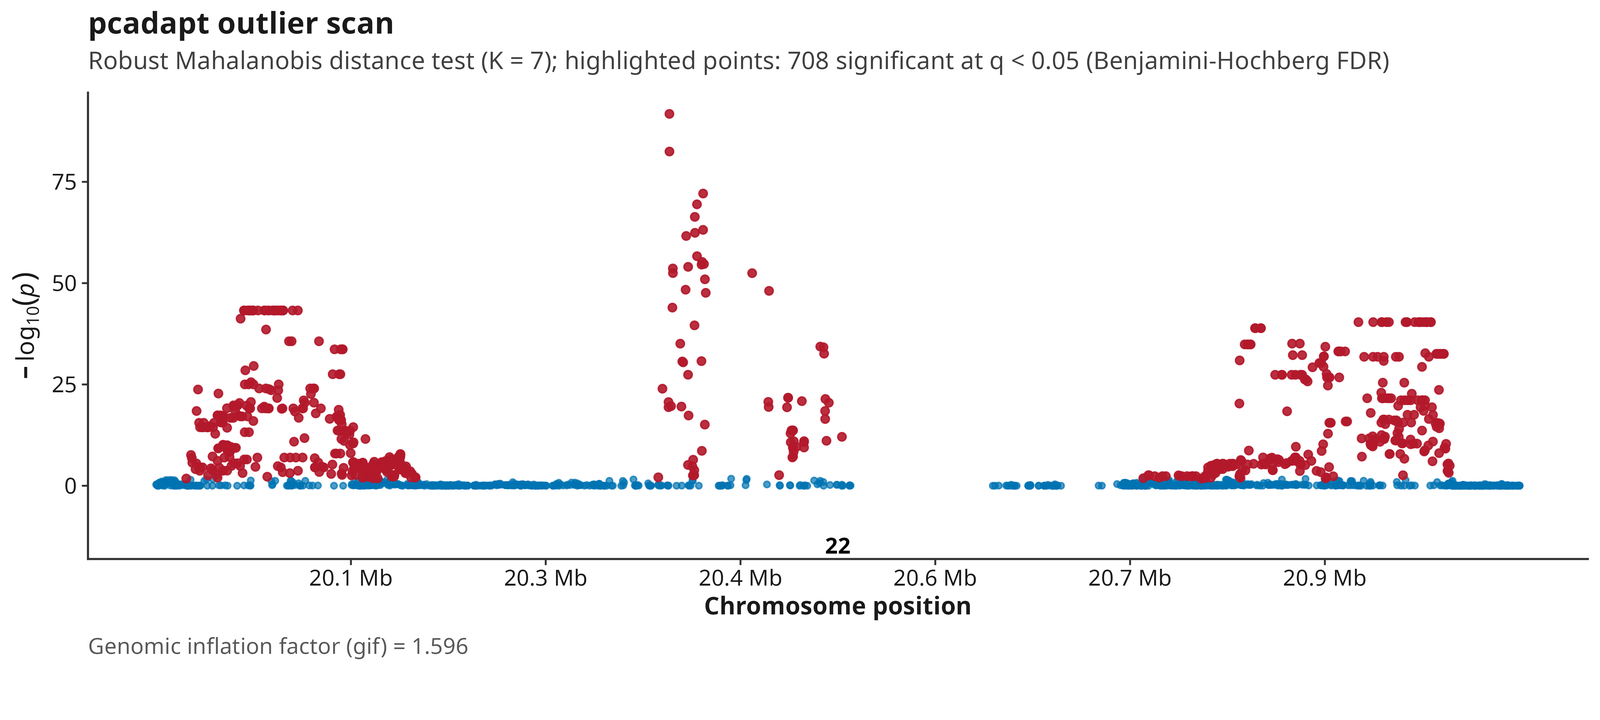
On the quickstart example (K=7), 708 of 1,969 tested loci (36%) are significant at q < 0.05 – read honestly, not as “708 independent selection targets.” The genomic inflation factor is 1.60: with 8 continental-scale populations this divergent spread across a comparatively modest marker panel, real elevated differentiation from ordinary genome-wide drift alone can affect a large fraction of loci, a known general limitation of PCA-based outlier scans under strong structure, not specific to this dataset. The significant loci also cluster into a handful of genomic windows rather than spreading uniformly, consistent with local LD in this deliberately unpruned marker set producing one effective signal across several correlated SNPs. Reassuringly, the strongest cluster (20.86-20.95 Mb) overlaps the single highest-FST window in the entire genome scan above (20.80-20.85 Mb, FST=0.172) – independent corroboration from two different statistical approaches, though still not proof of a specific selection target given the population-structure inflation already noted.
Linkage disequilibrium decay
43_LD_decay.tsv bins pairwise genotypic correlation
(r-squared) between SNPs by physical distance, computed on the
QC-passing, unpruned marker set – the LD-pruned set
used elsewhere (PCA, kinship, DAPC, ancestry) is specifically selected
to have low pairwise LD, so decay computed on it would
systematically understate how far real LD extends. A real limitation:
pairs beyond the SNP-index window analyses.ld_decay_slide
are never computed even if within
analyses.ld_decay_max_distance_bp, so the curve’s usable
range depends on marker density, not only on the configured distance
cutoff.
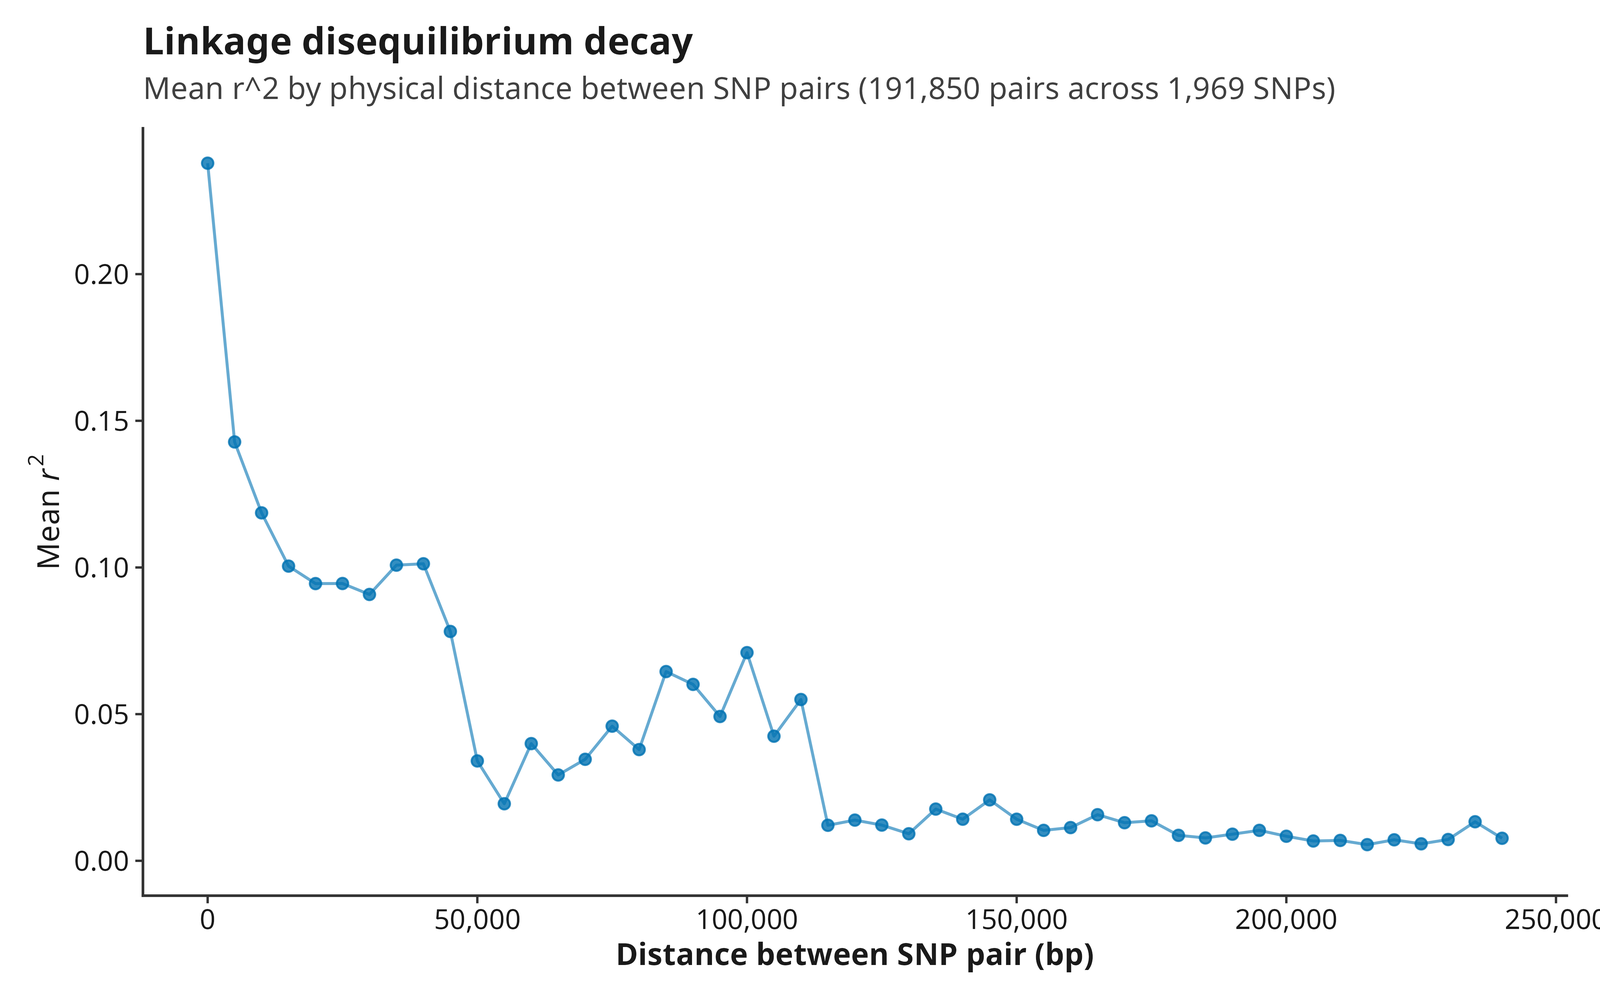
Mean r-squared falls from 0.238 at the shortest distance bin (0-5kb) to under 0.04 by roughly 50kb – a real, biologically sensible decay curve (not flat or noisy), consistent with typical human LD extent at this marker density.
LD-based effective population size
45_Ne_LD.tsv estimates contemporary effective population
size (Ne) per population from linkage disequilibrium between
cross-chromosome (effectively unlinked) SNP pairs – the
opposite pair selection from LD decay above, which specifically wants
physically close pairs (Waples 2006; Waples & Do 2008, the “LDNe”
method also implemented by the NeEstimator software). A single
realization’s LD-based Ne estimate has real, substantial sampling
variance – treat a point estimate as an order-of-magnitude indication,
not a precise count, especially without a confidence interval (not yet
implemented). ne = Inf means no drift signal was detectable
above sampling noise (a real, informative result, not a failure);
NA with ne_status = "below_formula_domain"
means the implied Ne is outside the estimator’s valid range.
This method fundamentally needs markers on at least two
chromosomes to work at all. The quickstart dataset’s retained
autosomal marker set is chr22-only by design (the same reason chromosome
X/Y are reserved for the sex-check module rather than pooled into other
analyses), so every population in the real reference run correctly
reports ne_status = "fewer_than_two_chromosomes" – an
honest, expected skip for this particular demo dataset, not a bug or a
broken feature. A real multi-chromosome VCF will produce real
per-population estimates.
DAPC
This package’s DAPC module discriminates unsupervised
find.clusters() partitions computed at each configured K,
not user-supplied population labels; the metadata
population column is used only for plot colour and as
ground truth for the reported assignment-accuracy diagnostic. Apparent
separation is therefore not independent confirmation that either the
clusters or any real population labels are biologically meaningful.
Document how many principal components and discriminant axes were retained, how those choices were validated, and whether sample sizes support the model. Avoid presenting discrimination between data-driven clusters as an unbiased discovery result about the sampled populations.
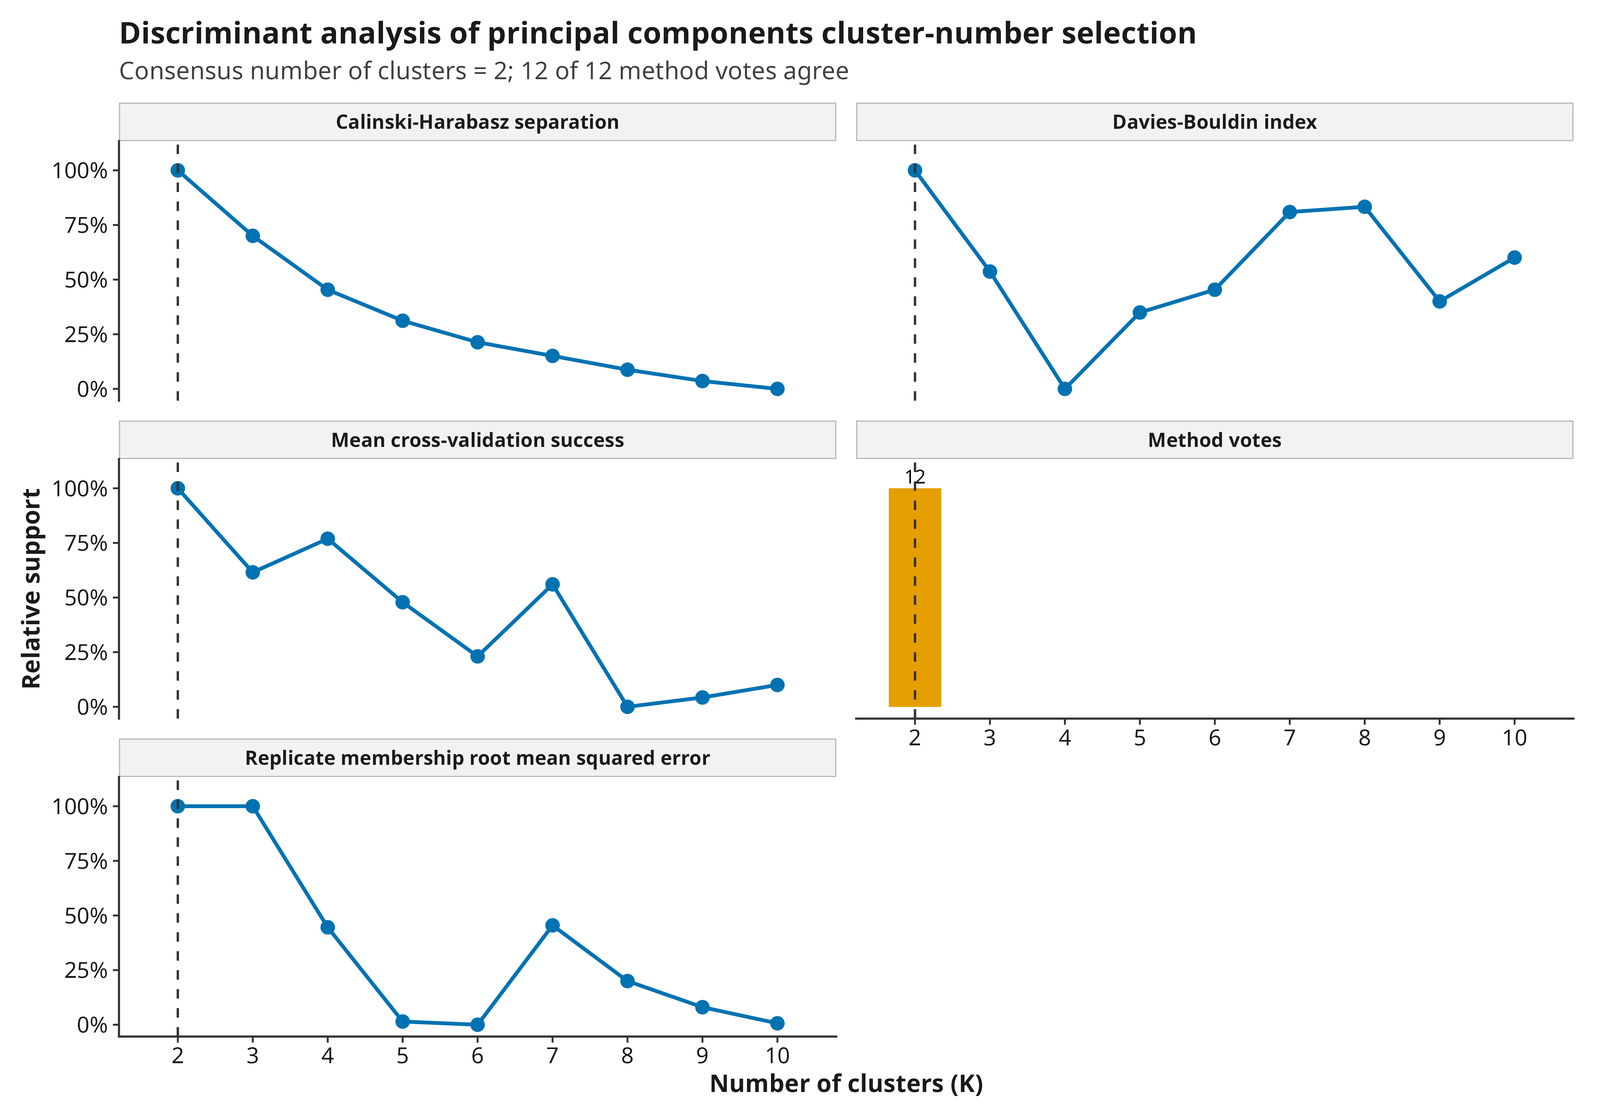
22d_DAPC_K_selection.tsv (a top-level convenience copy)
and the four 22e_DAPC_K_selection_*.tsv tables
(_methods, _scores, _votes,
_consensus) and this figure report the automatic
cluster-number consensus across BIC, mean cross-validation success,
Calinski-Harabasz, Davies-Bouldin, and replicate-membership RMSE. It is
a starting point, not a substitute for domain judgment about how many
groups the data can support.
The full report (22_DAPC_coordinates_K<k>.tsv,
22f_DAPC_loadings_K<k>.tsv, and figures) contains one
complete set of DAPC results for every requested K (2
through 10 by default), not only the consensus K shown here. Before
trusting any given K’s clustering, check its
replicate_max_rmse in 21_DAPC_diagnostics.tsv
against analyses.structure.reproducibility_rmse (default
0.05): a K at or below that threshold has reproducible replicate
membership across independent
find.clusters()/dapc() runs; a K above it does
not, and its clusters and loadings should not be interpreted, only the
consensus itself and the diagnostics that led to it. In the quickstart
example, the consensus is K=2 – mean cross-validation
success, Calinski-Harabasz separation, Davies-Bouldin index, and
replicate-membership RMSE all independently agree on it
(22e_DAPC_K_selection_votes.tsv). K=2’s own
replicate_max_rmse is effectively 0 (~2e-20, fully
reproducible, every replicate’s cluster membership correlating at 1.0);
most other K values in the same run exceed the threshold and are not
shown here for that reason – K=3 is a real exception
(replicate_max_rmse ~1.5e-17, also fully reproducible) and
is used below purely to illustrate figures a two-cluster model cannot
produce.
Retaining too many or too few PCs before the discriminant step is a
separate risk from picking the wrong K: too few PCs discards real
signal, too many starts to memorize individual samples rather than group
structure (in the extreme, retaining so many PCs that samples nearly
perfectly separate can make every K look artificially clean). By default
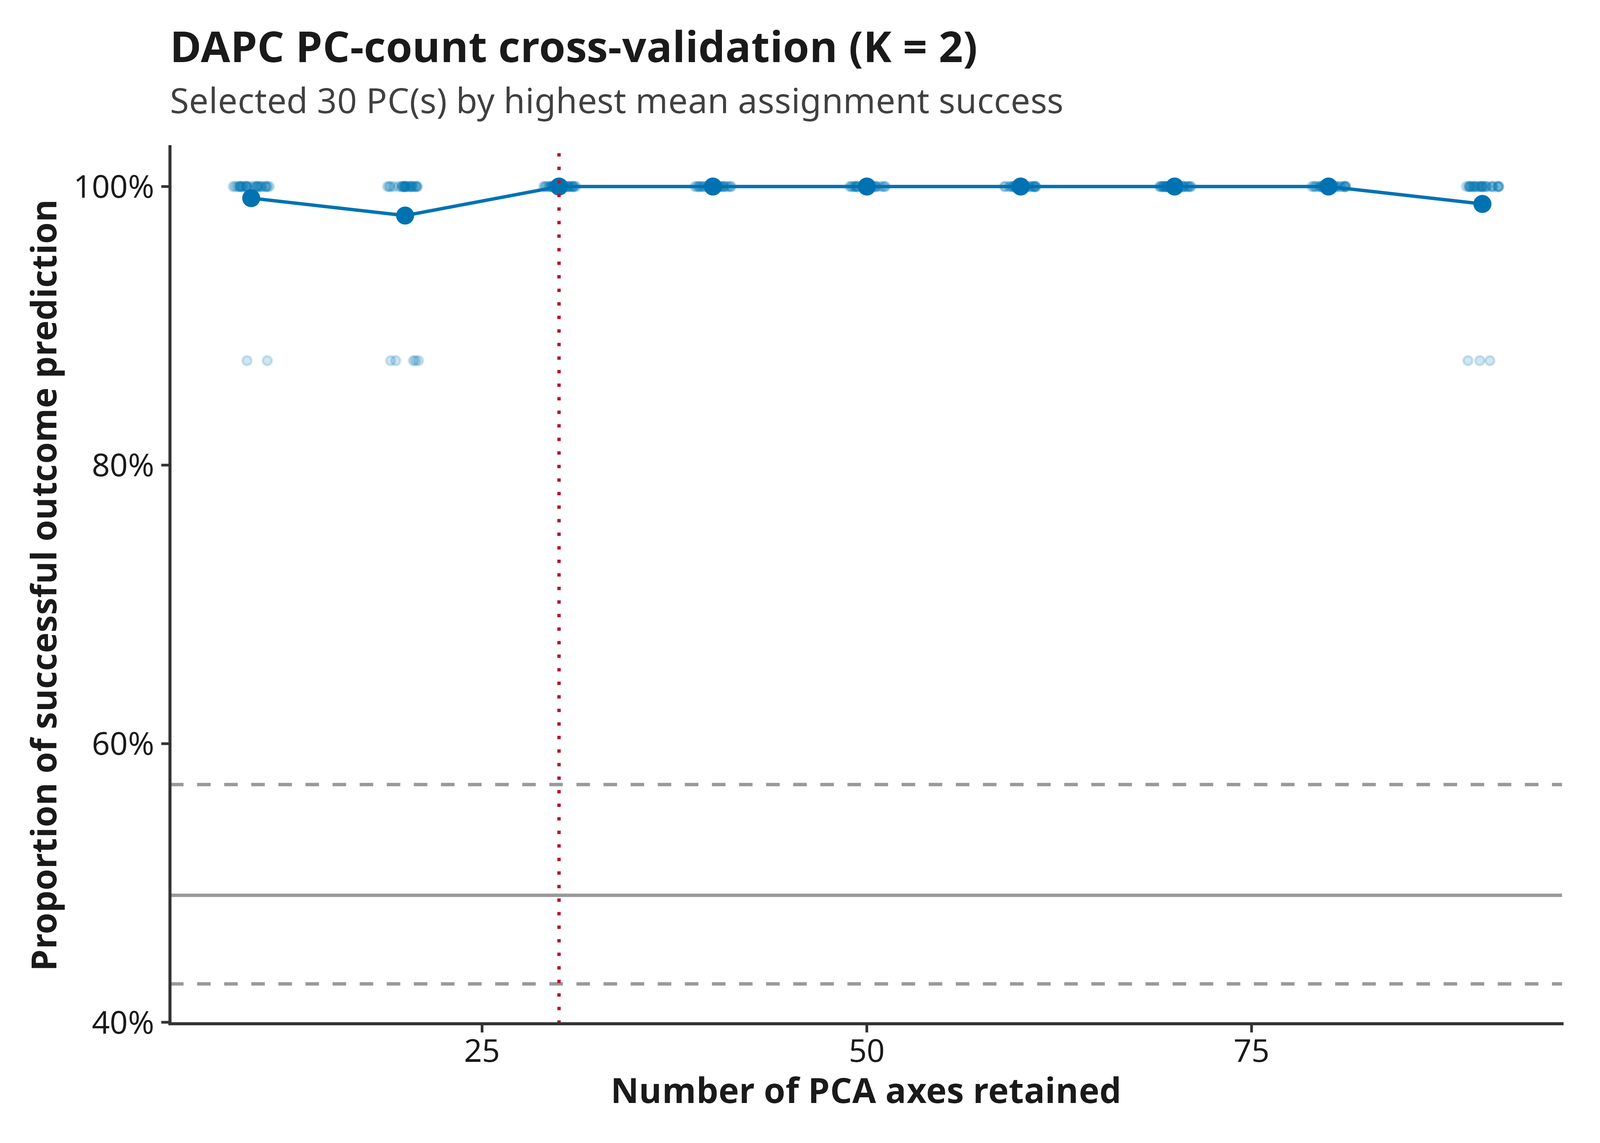
(analyses.dapc_cross_validation: true) each K’s number of
retained PCs is chosen automatically by
adegenet::xvalDapc() cross-validated assignment success,
not left at a fixed default – the number reported as n_pca
in 21_DAPC_diagnostics.tsv for that K (30 for the consensus
K=2). This figure shows the full diagnostic behind that choice, not just
the summary: every individual bootstrap replicate’s outcome (the
semi-transparent points – the same real per-replicate variability
adegenet::xvalDapc() itself computes but normally discards
after averaging), the mean curve connecting them, the full random-chance
reference band (2.5/50/97.5%, not just its median), and the selected PC
count marked directly on the curve. A tight cluster of replicate points
at each candidate count is reassuring; a wide spread means the “best”
count is closer to a coin flip among several similarly-plausible values
than a clean, confident peak – K=2’s own curve here is the tight case,
assignment success at or near 100% from a fairly small PC count
onward.
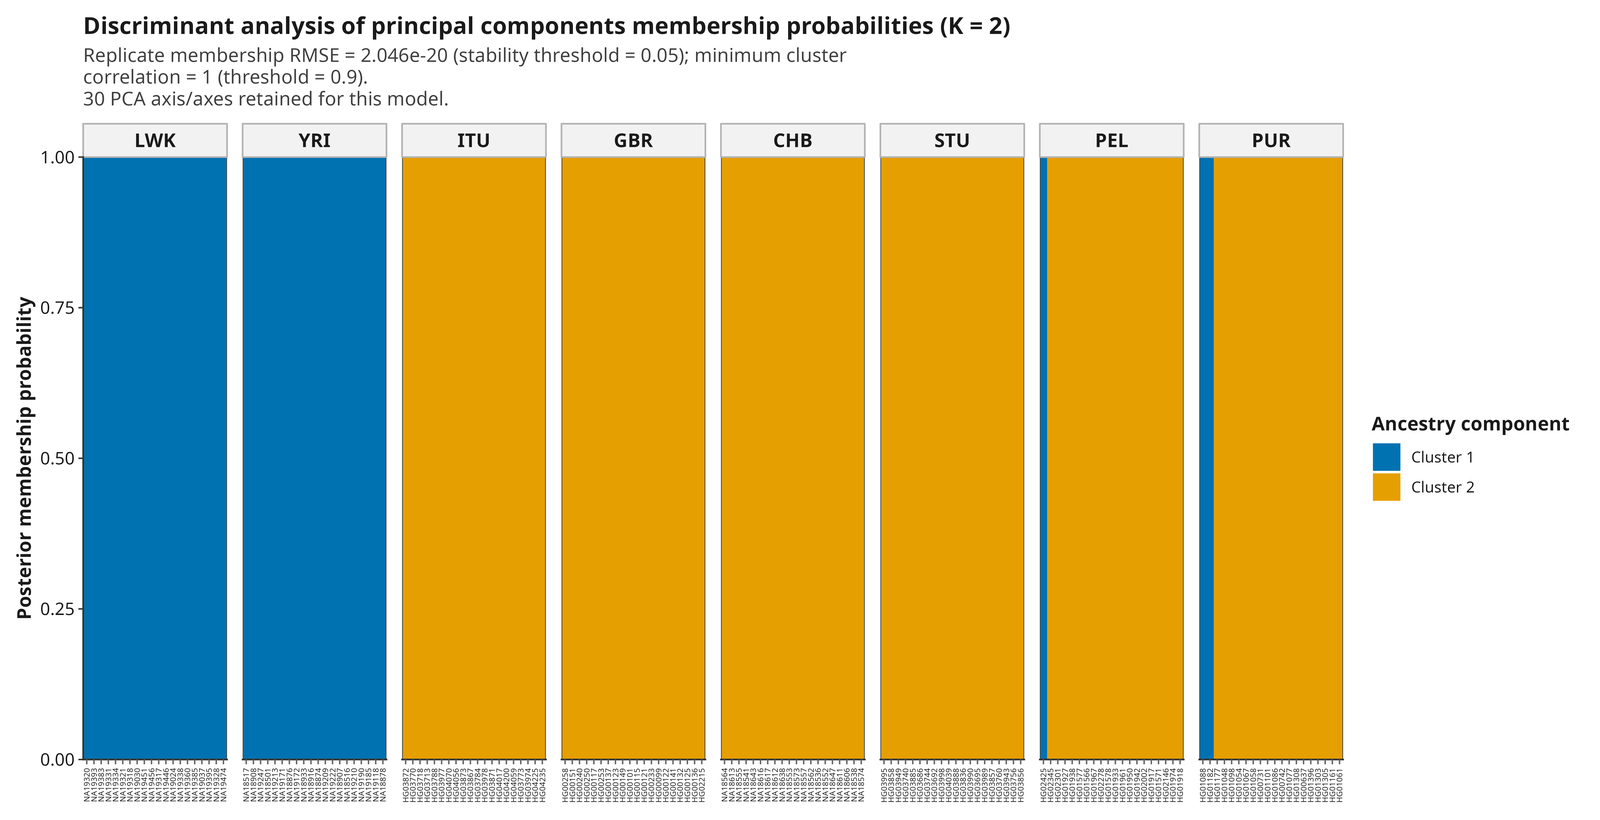
22b_DAPC_membership_K<k>.tsv and this figure
report each sample’s posterior membership probability for its assigned
cluster. At the consensus K=2, membership is essentially unanimous (mean
assignment success 1.0) – the two-cluster split this dataset supports
most strongly by every criterion above.
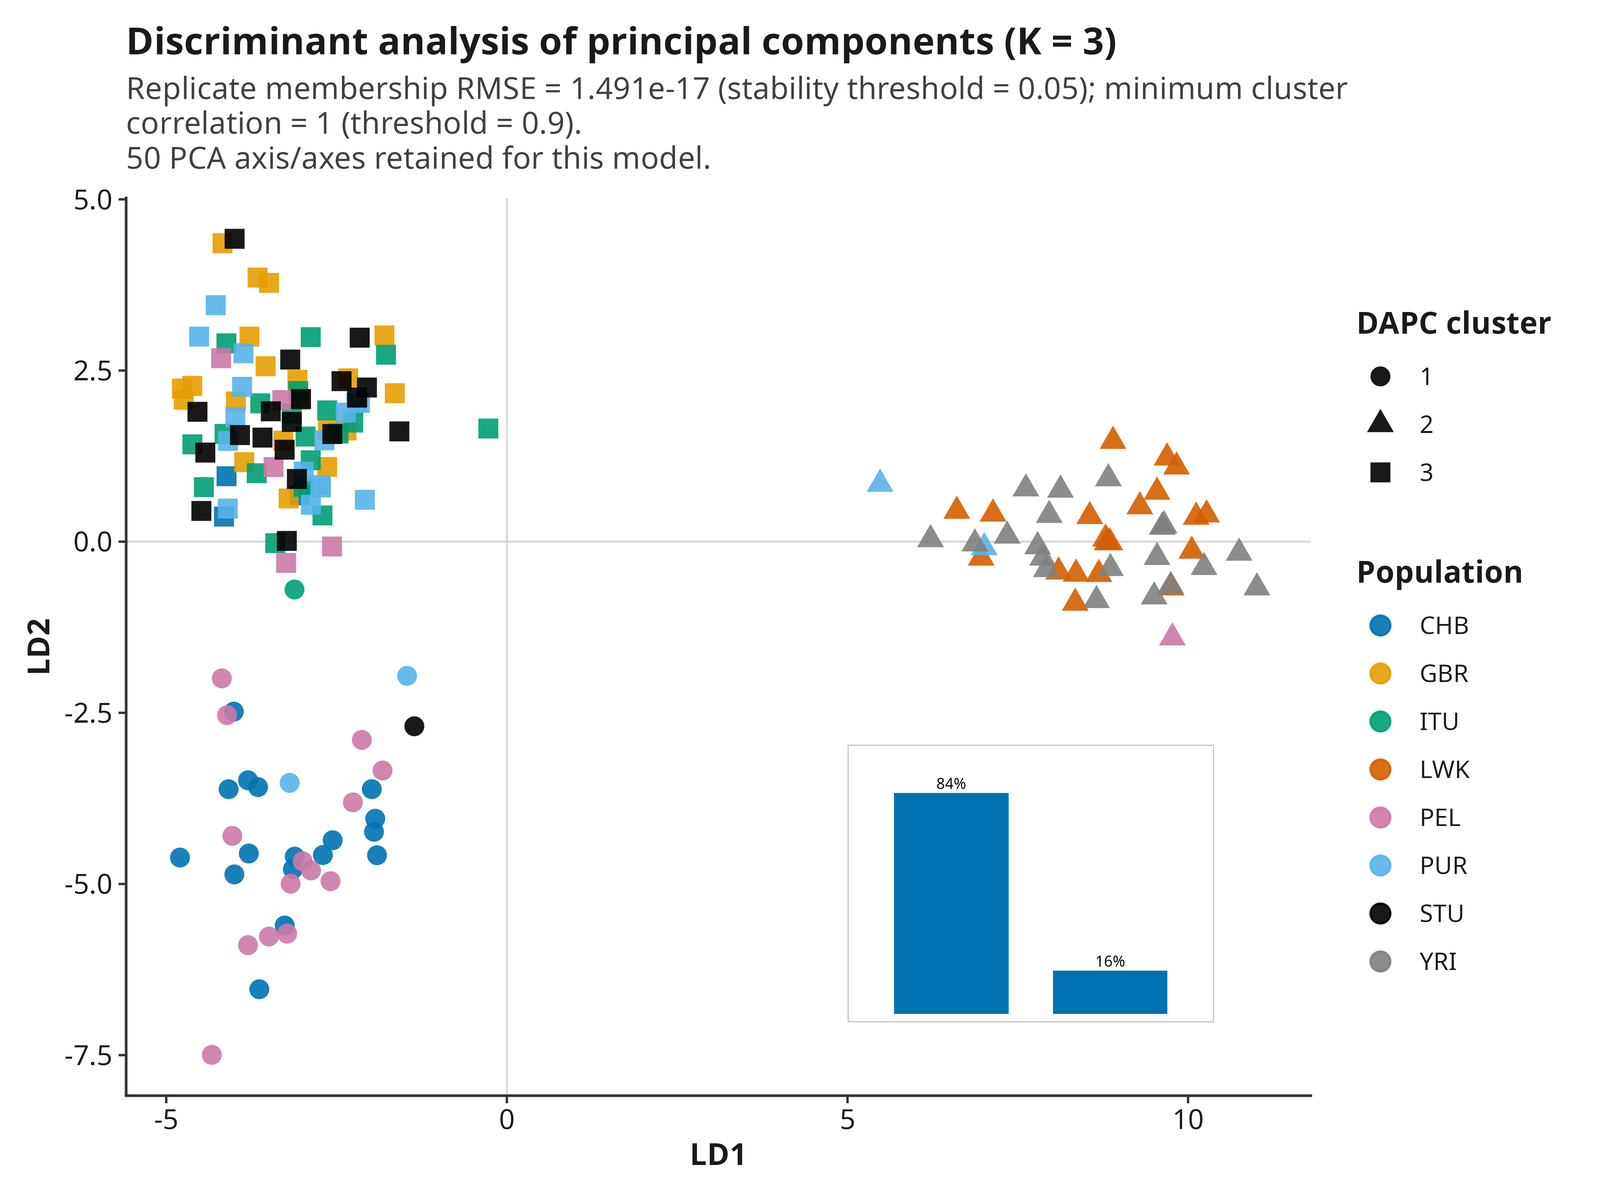
A K=2 model has only one discriminant axis by construction
(n.da, capped at K-1 by adegenet::dapc()) –
there is no second axis to plot against the first, so DAPC’s own 2D
scatter plot (with its eigenvalues inset, described next) is not
produced for K=2 at all; dapc$eig for K=2 is a single value
(100% of the between-group variance, trivially, since it is the only
axis). K=3 – also fully reproducible here, just not the automatic
consensus – is shown below instead, purely to illustrate what that
scatter and its eigenvalues inset look like once a model has two or more
discriminant axes.
A second, independent check on how many axes are worth trusting,
separate from the PC-retention question above, comes from the
discriminant analysis itself: dapc$eig, the between-group
variance each retained discriminant axis explains, drawn as a small
inset directly on the scatter plot below (no axis titles, positioned
wherever the fewest sample points are, so it never covers real data). A
steep drop after the first axis or two means later axes carry
comparatively little real separating power; a flat, undifferentiated set
of bars across many axes is a sign the discriminant step is not cleanly
separating the data either. At K=3, LD1 explains 83.6% of the
between-group variance and LD2 the remaining 16.4% – a steep, reassuring
drop given there are only K - 1 = 2 axes to retain at
K=3.
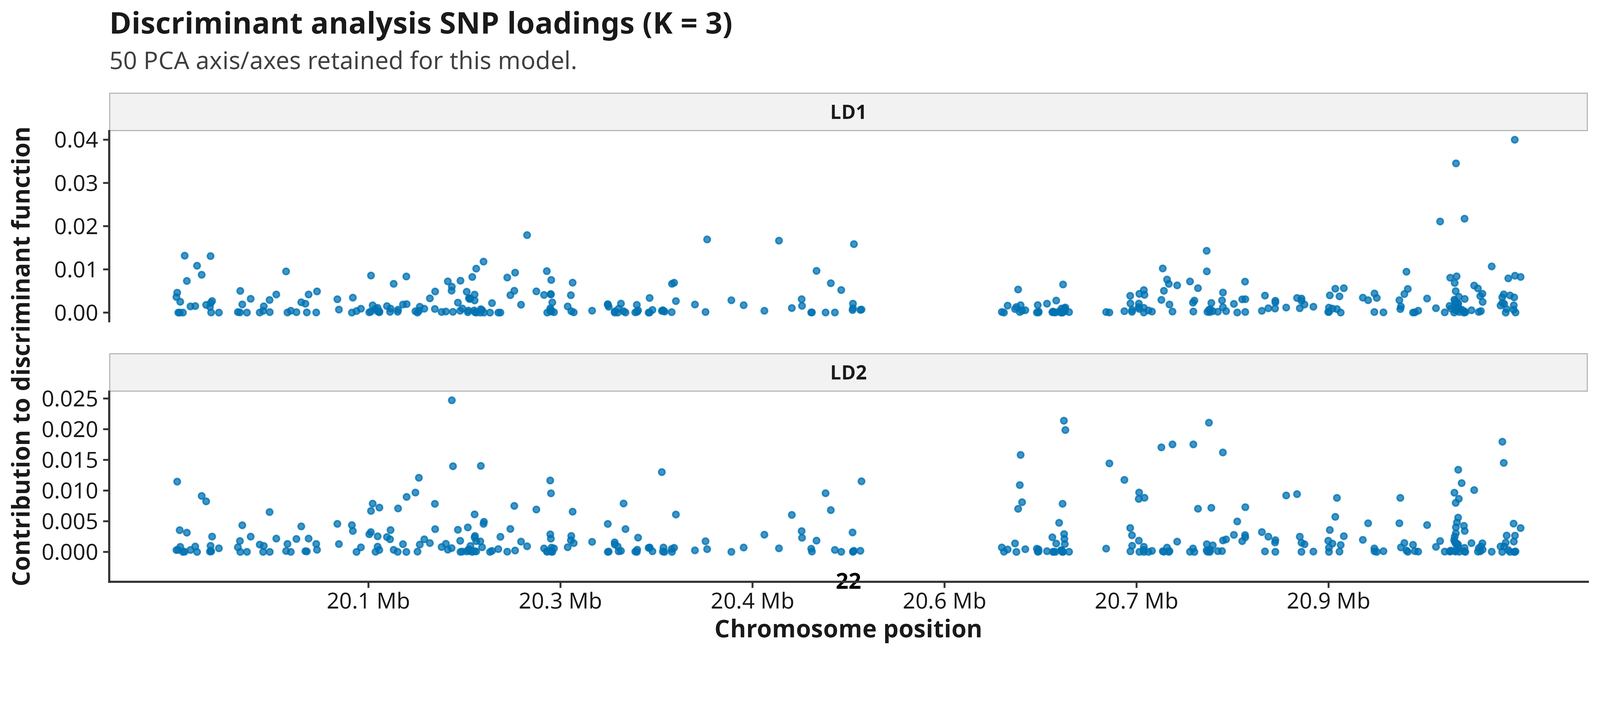
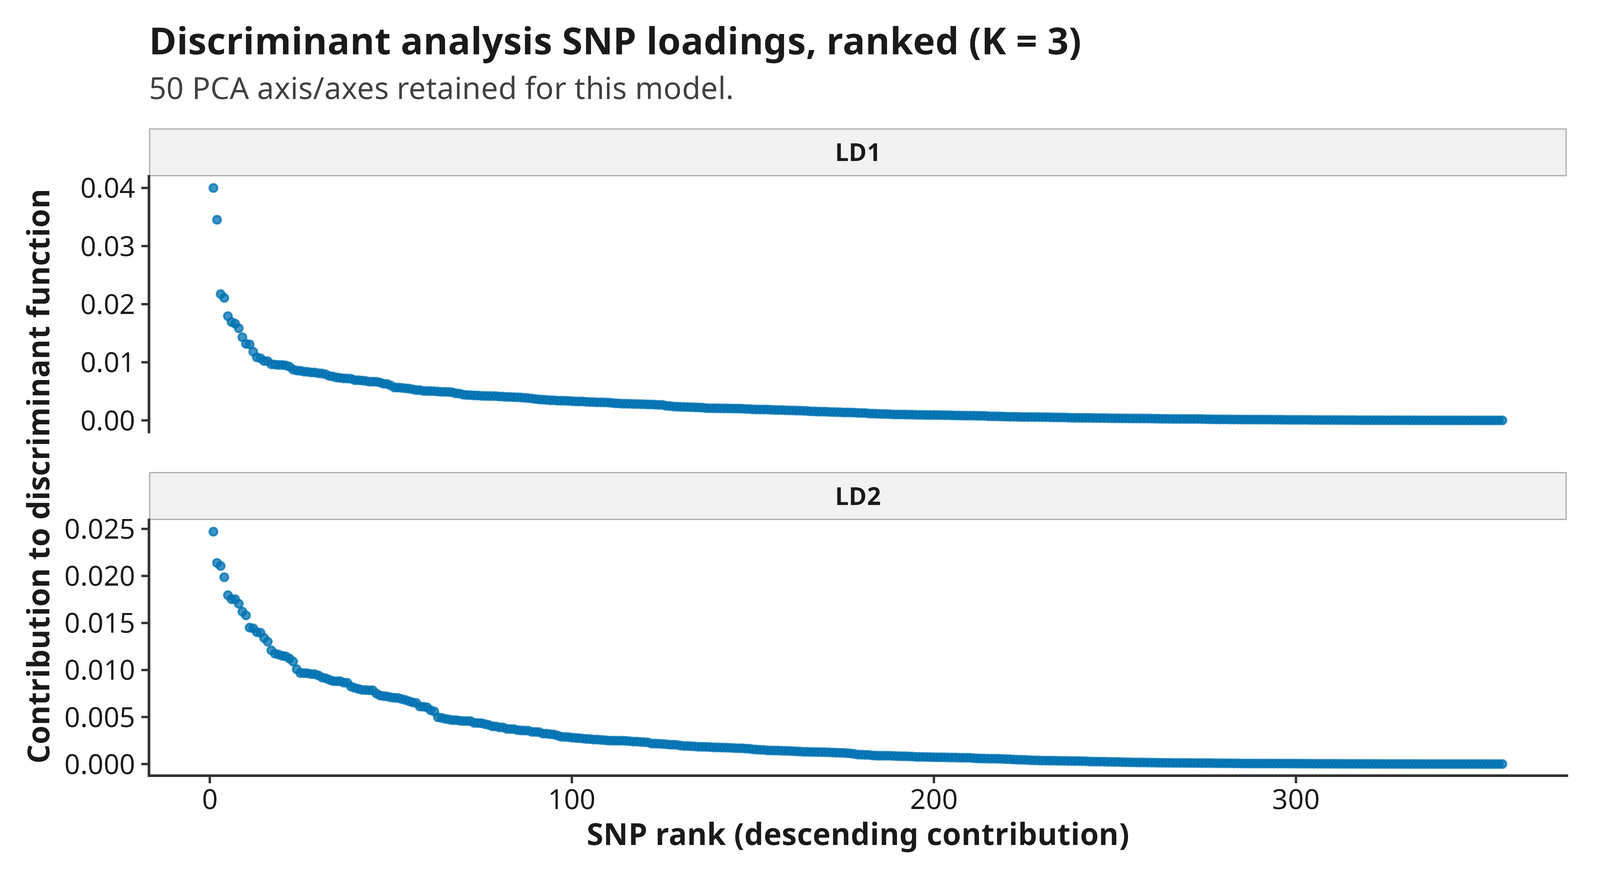
22f_DAPC_loadings_K<k>.tsv, plus a genomic
Manhattan-style figure and a rank-ordered figure, report each SNP’s
contribution to every discriminant function at each K. A large
contribution identifies a marker that helped separate that K’s clusters;
it does not by itself establish biological cause.
AMOVA
Analysis of molecular variance (Excoffier et al. 1992, via
poppr::poppr.amova()) partitions total genetic variance
hierarchically – between populations, between samples within
populations, and within samples – and tests each component’s
significance by permutation (ade4::randtest(), 999
permutations, not currently configurable). Its meaning depends entirely
on the hierarchy tested, the distance definition, and the permutation
design – state all three. Interpret a negative variance component
transparently (a real, expected outcome of the estimator under weak or
absent true structure, not an error) rather than silently truncating it
to zero.
24_AMOVA_phi_statistics.tsv’s
Phi-population-total is the same quantity as FST in this
hierarchical framework – the fraction of total variance attributable to
among-population differences, computed by an entirely different route
(variance partitioning on a distance matrix, rather than FST’s
allele-frequency-based estimator). On the quickstart example,
23_AMOVA_components.tsv partitions total variance into
9.04% between-population, 4.27% between-samples-within-population, and
86.69% within-samples; Phi-population-total = 0.0904, and
all three components are significant at p = 0.001 (999/999 permutations,
the permutation floor). This 9.04% is an independent, method-agnostic
confirmation of the same ~9% among-population signal already reported by
Weir and Cockerham’s (1984) global FST (0.0915) and Weir and Goudet’s
(2017) population-specific FST (global_beta_fst = 0.0915)
above – three different estimators converging on the same real value
from the same real population structure, not three unrelated numbers
that happen to look similar.
Multilocus genotype (MLG) and clonal diversity
poppr::poppr()/poppr::mlg.id()/poppr::genotype_curve()
(Kamvar, Tabima, and Grunwald 2014) ask a question distinct from kinship
above: not “how related are these two samples,” but “do these two
samples have exactly the same genotype at every analyzed locus”
– the standard signal for clonal replicates, accidental resampling, or
duplicate sample submissions.
Two genuinely different marker sets feed this module, deliberately.
57_MLG_groups.tsv (exact duplicate-genotype detection, via
mlg.id()) uses the full, unpruned QC-passing locus set –
fewer markers would make it more likely that two genuinely
different individuals coincidentally match at every retained locus, so
exact identity needs maximum discriminating power.
56_MLG_diversity_summary.tsv (MLG count, eMLG, Shannon’s H,
Stoddart-Taylor’s G, Simpson’s lambda, evenness, and the index of
association Ia/rbarD, via poppr()) and the genotype
accumulation curve below instead use the LD-pruned locus set – the same
set already used for kinship/PCA/DAPC elsewhere in this pipeline. Both
originally reused the full unpruned set “for consistency with AMOVA,”
but a real production run found that wrong on two counts at once: a
50-sample, 561,767-locus unpruned cohort took 29+ hours in
poppr()’s Ia/rbarD computation alone (confirmed superlinear
in locus count by direct scaling measurement), and Ia/rbarD’s own
null-model interpretation assumes approximately independent input loci,
so feeding it hundreds of thousands of physically linked SNPs
mechanically inflates the appearance of non-random multilocus
association through ordinary linkage, not real clonal signal. See
R/clonality.R’s top-of-file comment for the full
measurement and reasoning.
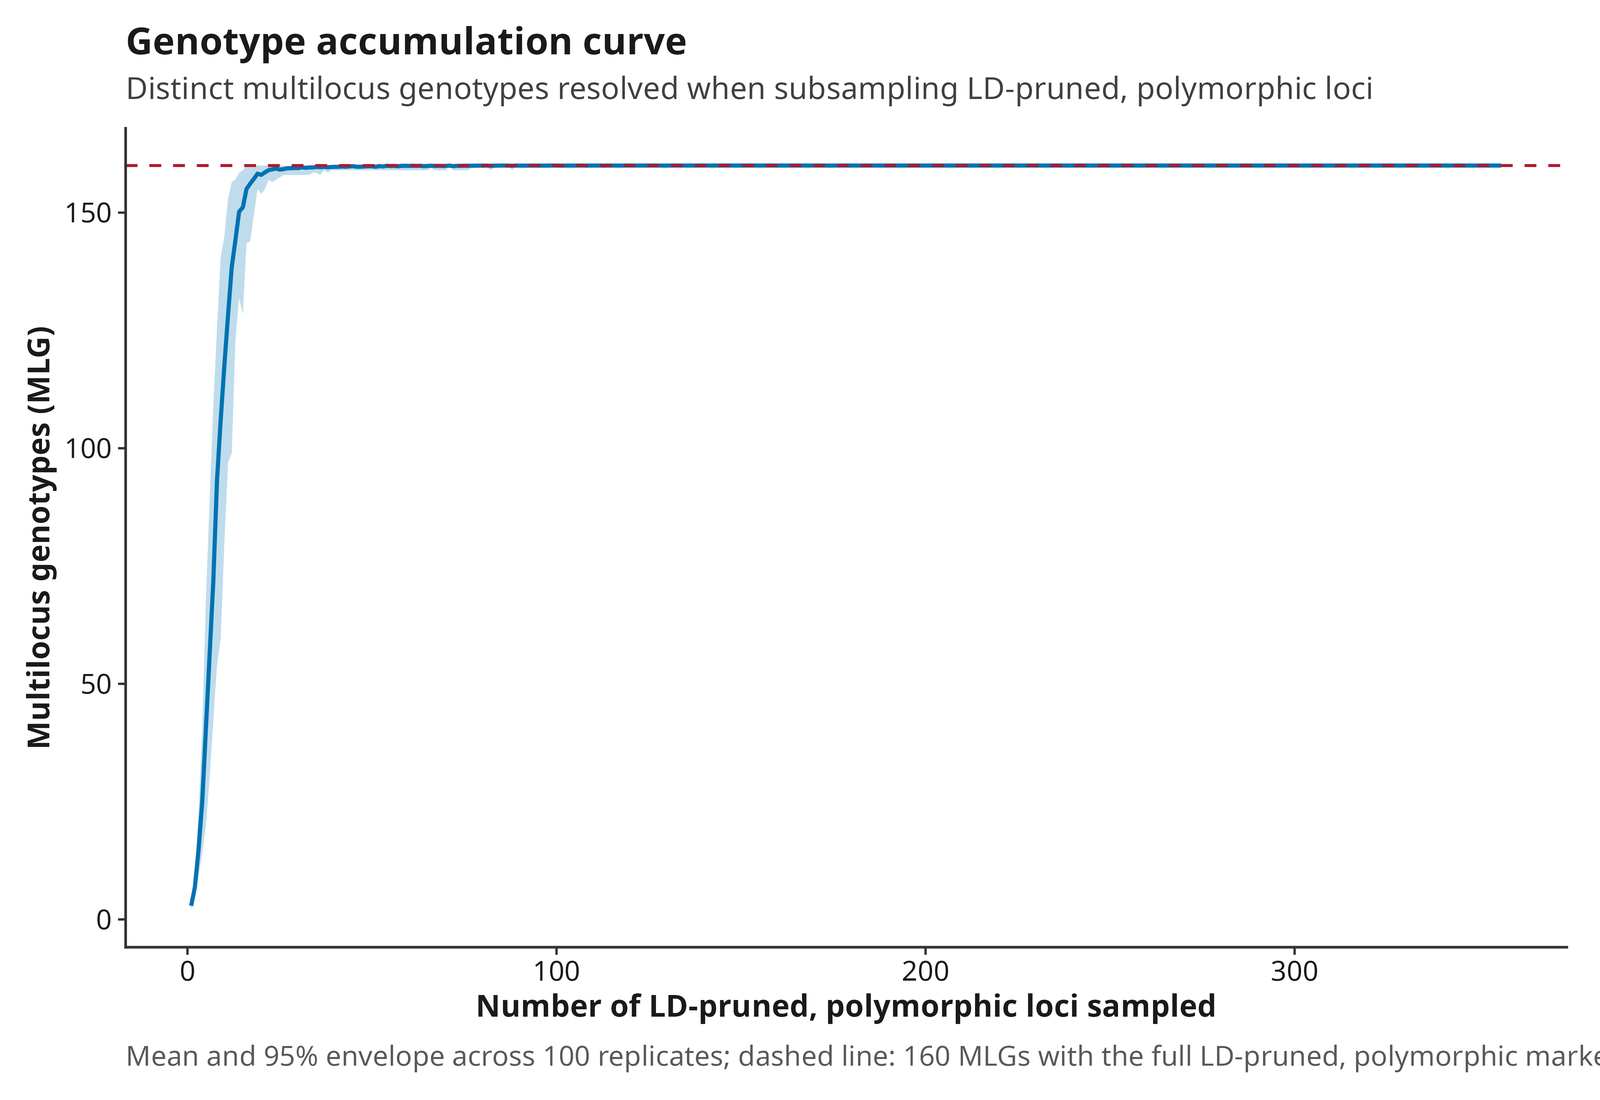
On the quickstart example, all 160 samples have a unique multilocus
genotype across the full 1,969 QC-passing loci this module reuses from
the diversity module (not the 357-SNP LD-pruned set kinship/PCA/tree
use) – 57_MLG_groups.tsv is empty. Notably, this includes
the one pair kinship classifies as duplicate/MZ twin
(NA19331/NA19334, kinship = 0.4459): on this
larger marker panel their genotypes are not bit-identical – the expected
difference between a continuous relatedness estimator and exact genotype
matching, not a contradiction. The accumulation curve and Ia/rbarD
summary run on the 357-SNP LD-pruned set instead, and saturate almost
immediately: a mean of 150 of the 160 possible MLGs are already resolved
with only 14 of the 357 available LD-pruned loci, deterministically
saturating at 71 loci. Ia/rbarD are still positive overall (Total Ia =
2.28, rbarD = 0.0066) but far smaller than the full-unpruned-set values
this module reported before this change (Ia = 35.40, rbarD = 0.0185) –
concrete confirmation that most of that earlier signal was ordinary
physical linkage, not clonal structure, in this genuinely outbreeding
human dataset. Read any remaining positive value cautiously either way,
not as direct clonality evidence. A monomorphic locus (identical
genotype at every retained sample) carries zero information for either
question this module asks, so this pipeline drops monomorphic loci once,
up front, from both marker sets, rather than leaving
poppr() to compute over them uselessly – reported directly
by a user whose real 50-sample cohort (561,767 unpruned / 54,052
LD-pruned loci) still took 8.3 hours in this module even after the
LD-pruning fix above. Dropping is correctness-neutral for both sets
(unlike LD-pruning, which trades discriminating power for speed on the
Ia/rbarD side only). Rather than naming each dropped locus on the
console (poppr’s own default for the ones it discovers internally, which
floods the log on a real marker panel), this pipeline logs only the
count and writes the full list, one locus name per line, to
57b_monomorphic_loci_dropped.csv (full set, before
duplicate detection) and 58c_monomorphic_loci_dropped.csv
(LD-pruned set, before Ia/rbarD/the curve/the MSN) – each present only
when at least one locus was dropped from that set. Neither is written
for the quickstart example: none of its loci are monomorphic.
A minimum spanning network (MSN; Kamvar, Tabima, and Grunwald 2014,
poppr::poppr.msn(), the same LD-pruned marker set as the
accumulation curve above) draws a complementary picture: a
genetic-distance network connecting each clone-corrected multilocus
genotype (one node per distinct genotype, larger when more than one
sample shares it – see 58b_MSN_edges.tsv for every edge’s
endpoints and distance) to its nearest neighbors, rather than either a
bifurcating tree (the NJ trees above) or a fixed low-dimensional
projection (PCA/DAPC). Unlike the tutorial’s own
bruvo.msn(), which assumes a stepwise mutation model
appropriate for microsatellite repeat lengths, this uses
poppr::diss.dist() – a discrete/Hamming-style distance
poppr documents as usable for any marker system.
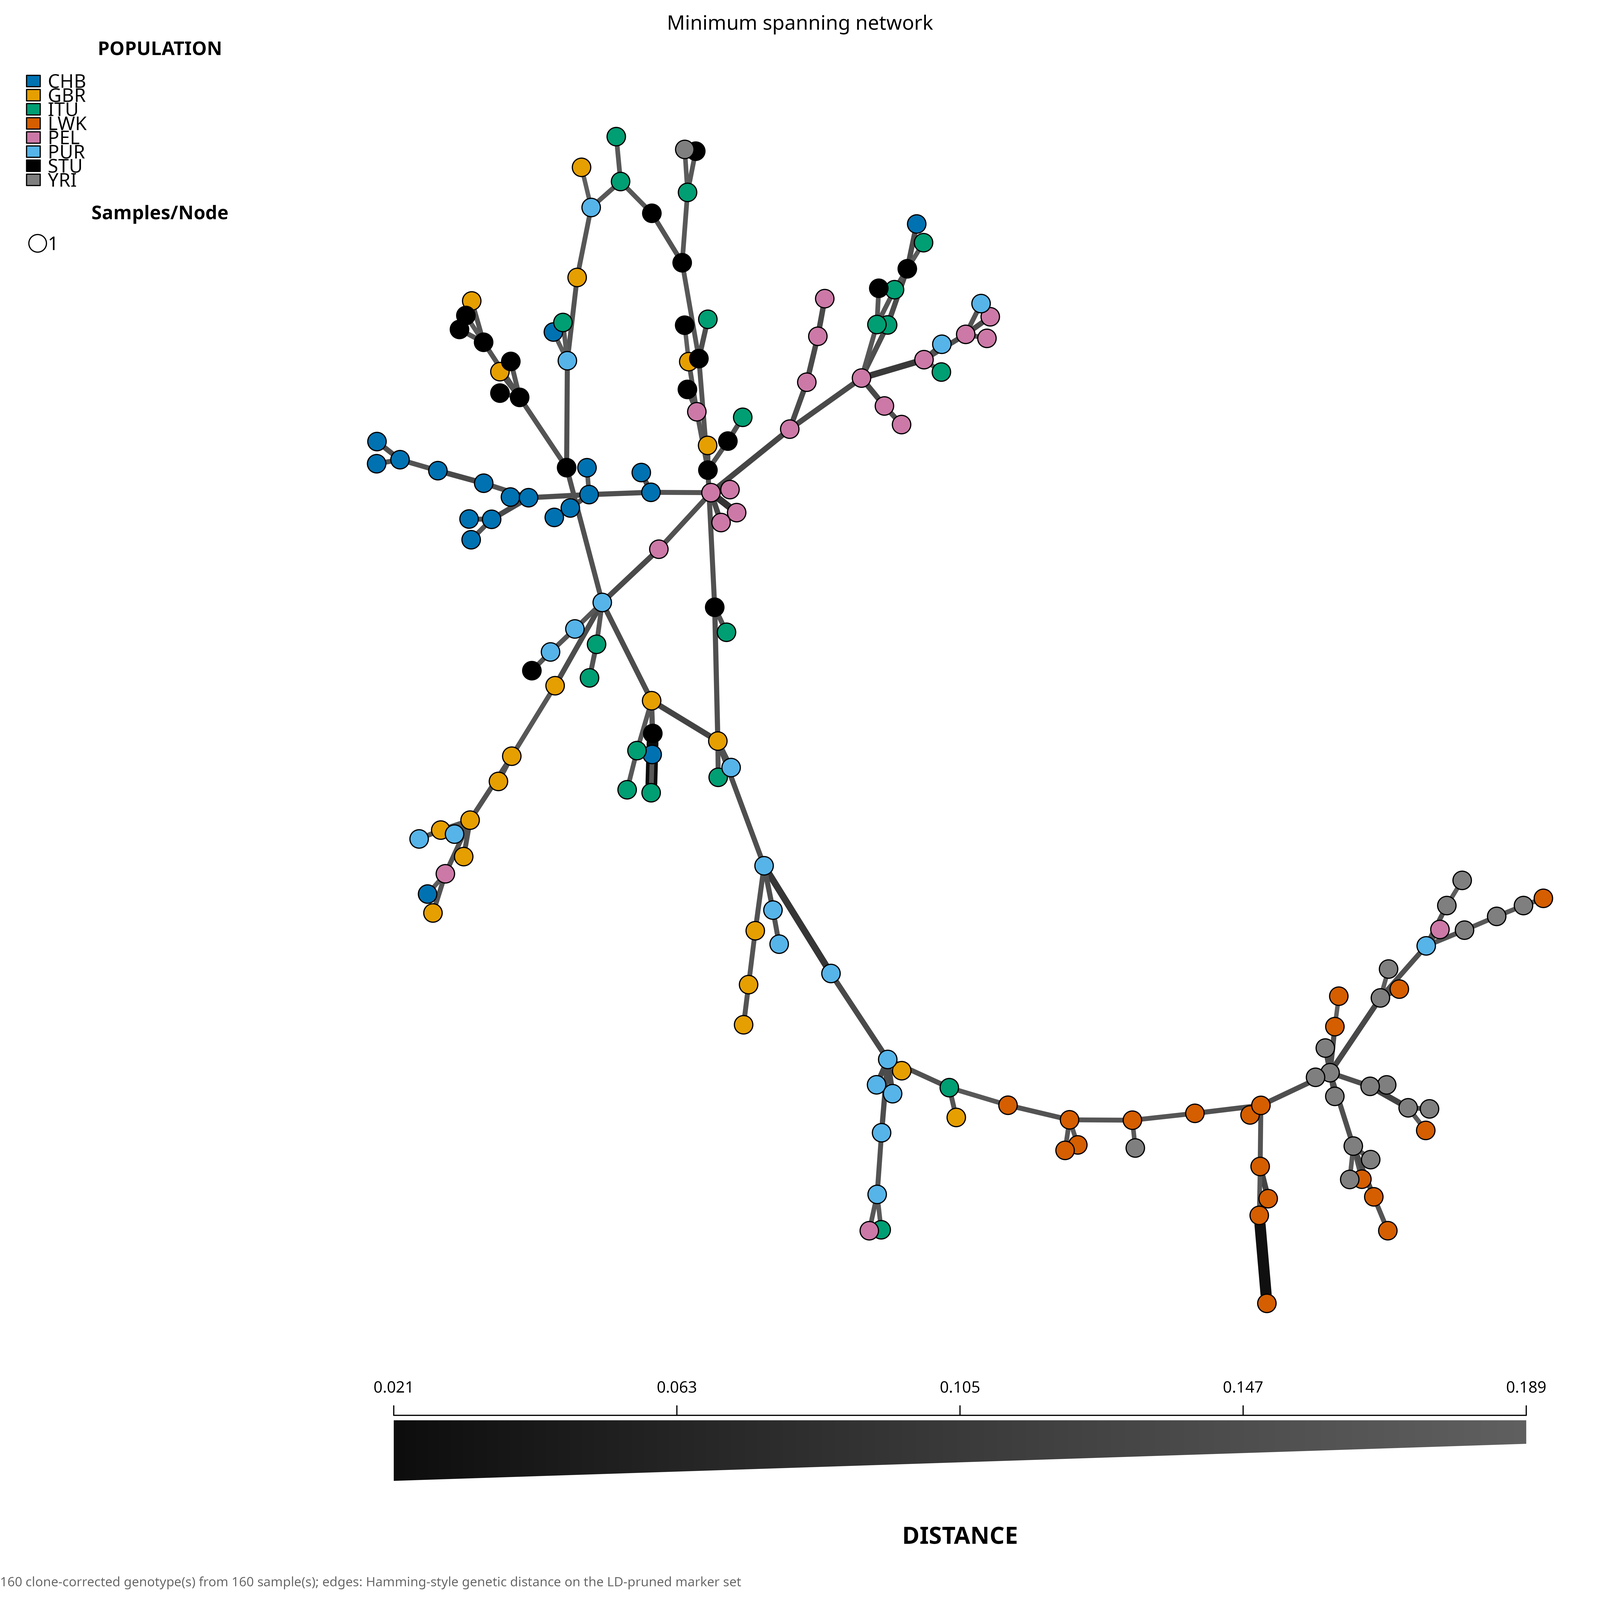
On the quickstart example, every one of the 160 samples remains its
own node even on the LD-pruned set (no edges collapse into a
multi-sample node), consistent with the accumulation curve’s own
near-immediate saturation above. Reading the network from
58b_MSN_edges.tsv rather than by eye: the overall
same-population/cross-population edge-distance split is modest (mean
0.154 within a recorded population vs. 0.162 across two, out of 162
total edges) – individual pairwise distance on a 357-SNP panel does not
cleanly separate these populations the way aggregate multi-locus methods
(PCA, FST) do, consistent with the same ~9% FST/AMOVA-among-population
signal reported above rather than a sharper one. Some specific structure
is real and verifiable, though: CHB (East Asian) forms a largely
self-contained subcluster (18 of its 21 incident edges connect two CHB
samples to each other) with only single, separate bridging edges out to
six other populations, no one of them dominant; LWK and YRI (African)
likewise mostly connect to each other (28 of 36 edges touching either
population). Both observations echo, from a genuinely different
node-and-edge method, the same population-structure signal PCA/DAPC/FST
report elsewhere in this document – not a new finding on its own. A
sample whose shortest edge crosses into a different population’s
genotypes is worth checking against its PCA/DAPC placement and kinship
results before trusting its recorded population label.
Sex-biased dispersal test
hierfstat::sexbias.test() (Goudet, Perrin, and Waser
2002) asks a population-level question distinct from the
individual-level tests above: does one recorded sex disperse more than
the other? The signal comes from each individual’s assignment index
(AIc, Favre et al. 1997) – how strongly their genotype matches their own
recorded population’s allele frequencies, corrected for sample size. The
default mAIc test is a two-sample t-test comparing mean AIc
between the two recorded sexes;
60_sexbias_AIc_by_sample.tsv reports the per-sample
assignment index. This deliberately uses the metadata sex
column, not sex-check’s genetically inferred sex: sex-check asks whether
one sample’s genotype is consistent with its own recorded sex, while
this asks whether the two recorded sexes differ, as groups, in how
strongly their genotypes match their recorded population.
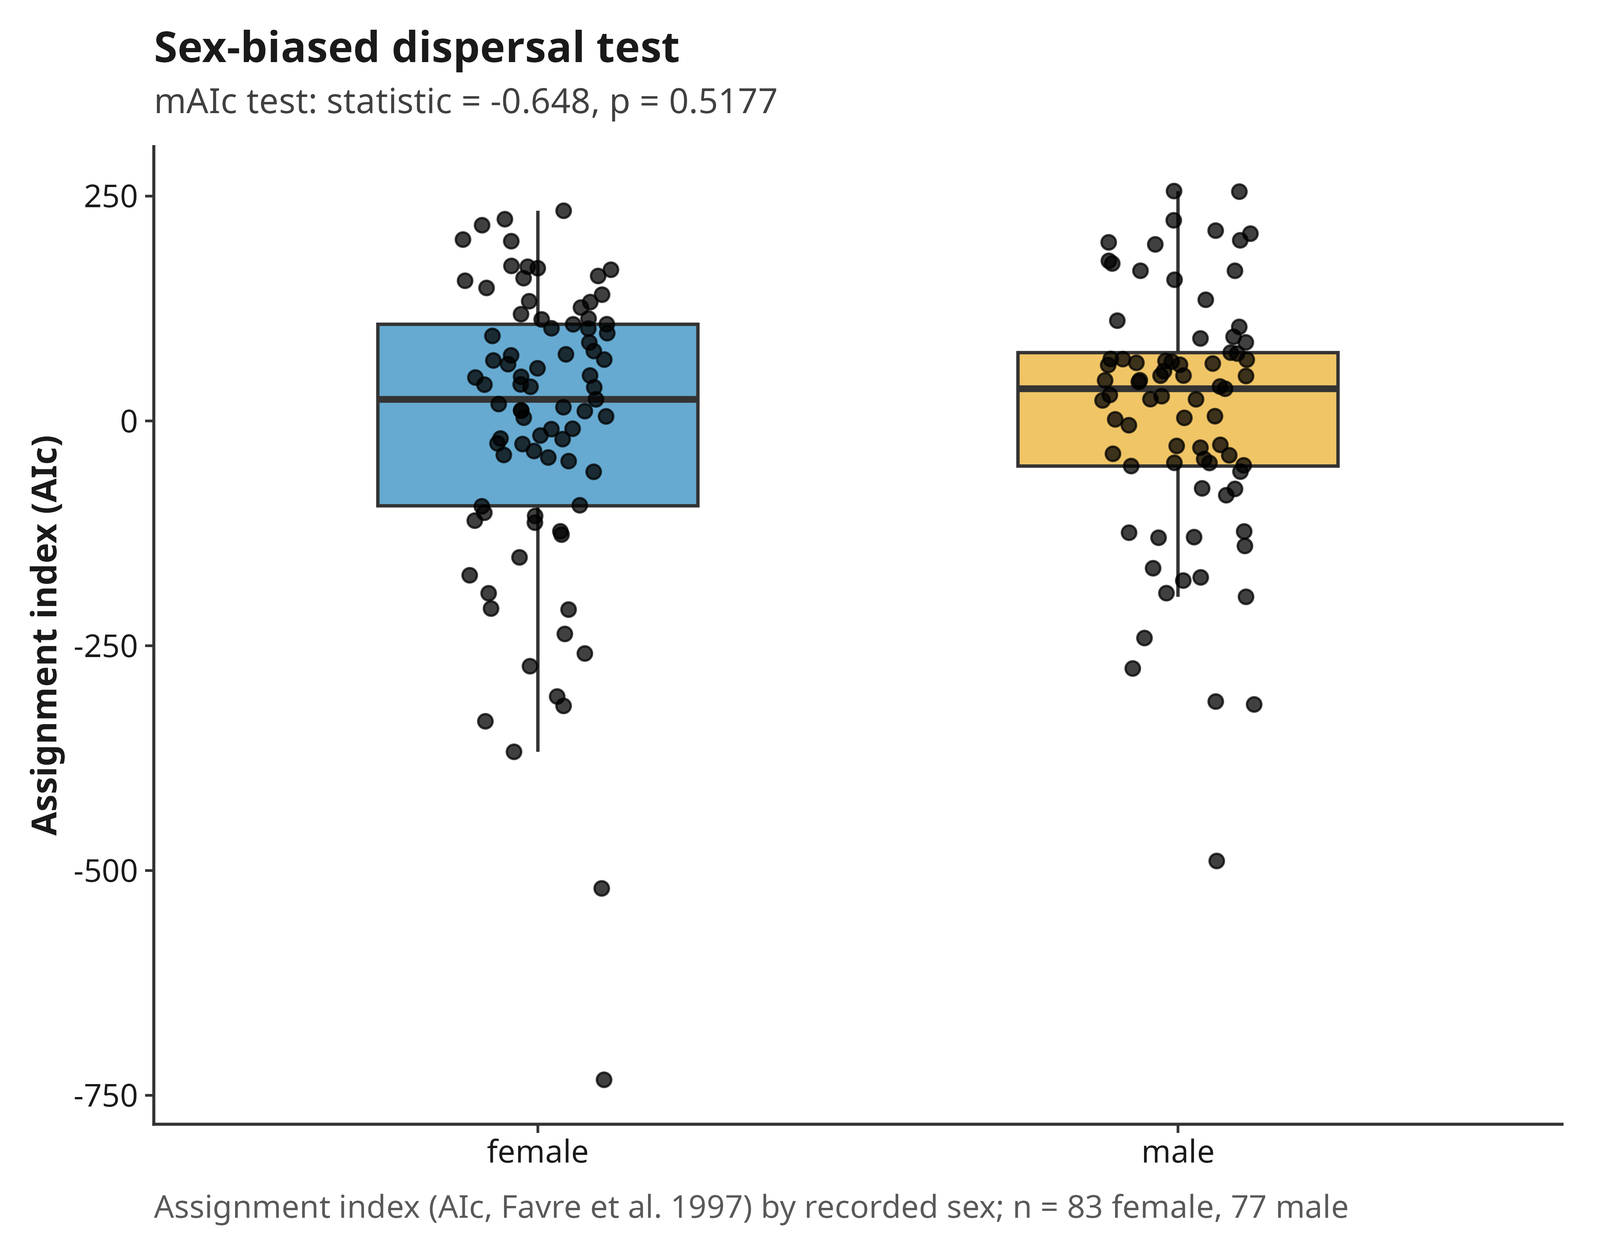
On the quickstart example, mean AIc does not differ detectably by recorded sex (mAIc t-test statistic = -0.648, p = 0.5177, n = 83 female, 77 male). That null result is expected, not a modeling failure: the quickstart dataset pools eight geographically distinct 1000 Genomes populations sampled cross-sectionally for genomic diversity, not a single species/site dispersal study with individuals genotyped at their natal versus breeding location – the setting this test was designed for.
Ancestry models
ADMIXTURE, fastStructure, and sNMF are not run by
default (analyses.admixture,
analyses.faststructure, and analyses.snmf all
default to enabled: false). Each is an external, optional
dependency – ADMIXTURE and fastStructure are separate command-line
programs, not R packages – and none is required for the rest of
popgenVCF to work. See the ancestry
backend guide to enable one.
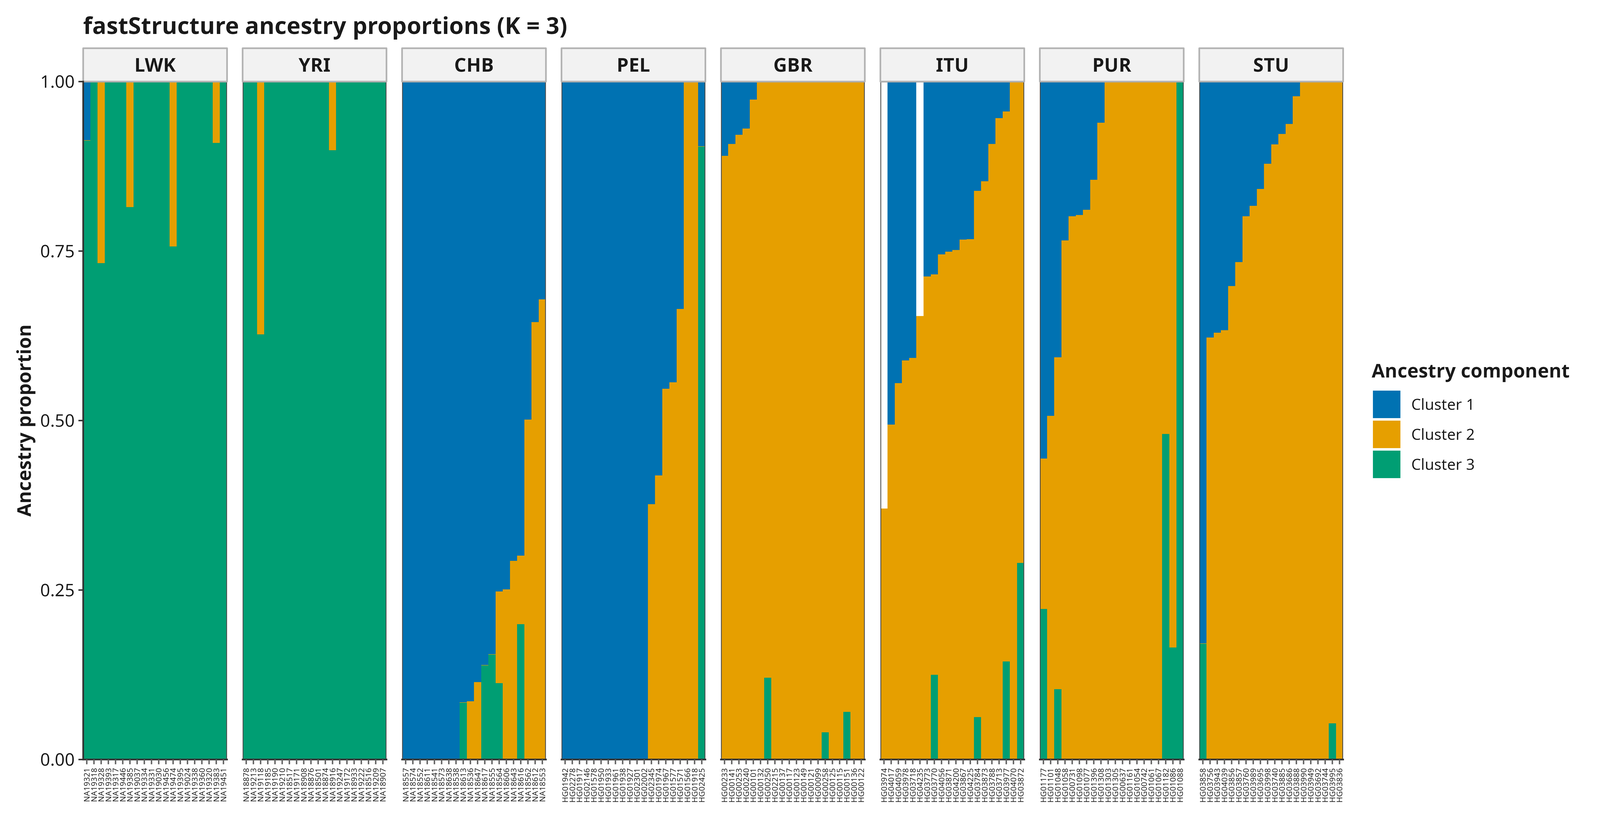
ADMIXTURE, fastStructure, and sNMF estimate model-dependent ancestry proportions. Cluster labels are exchangeable, and the selected K is not a literal count of ancestral populations.
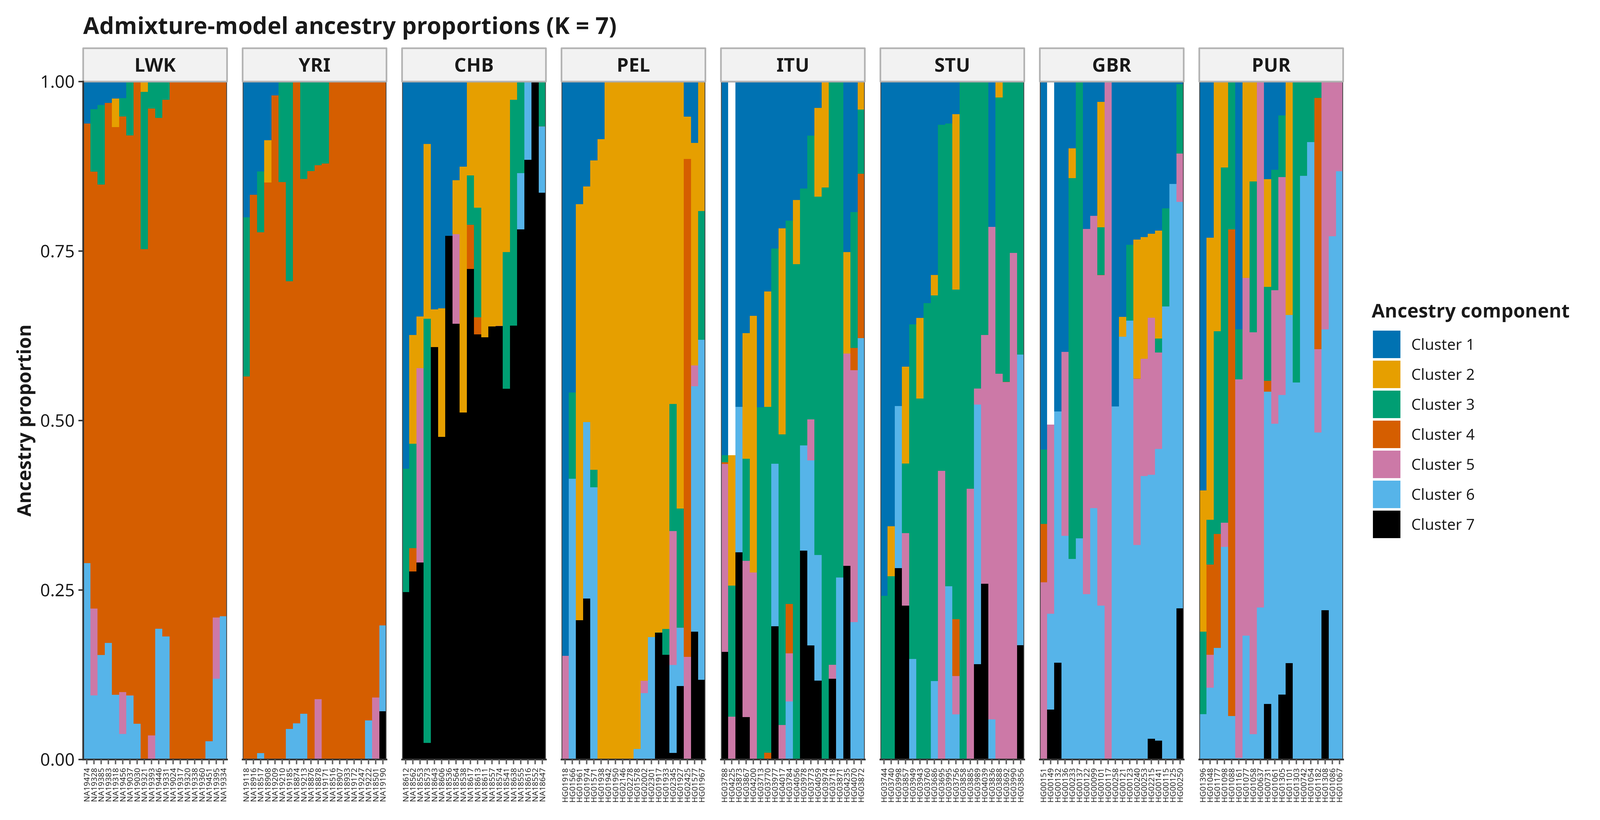
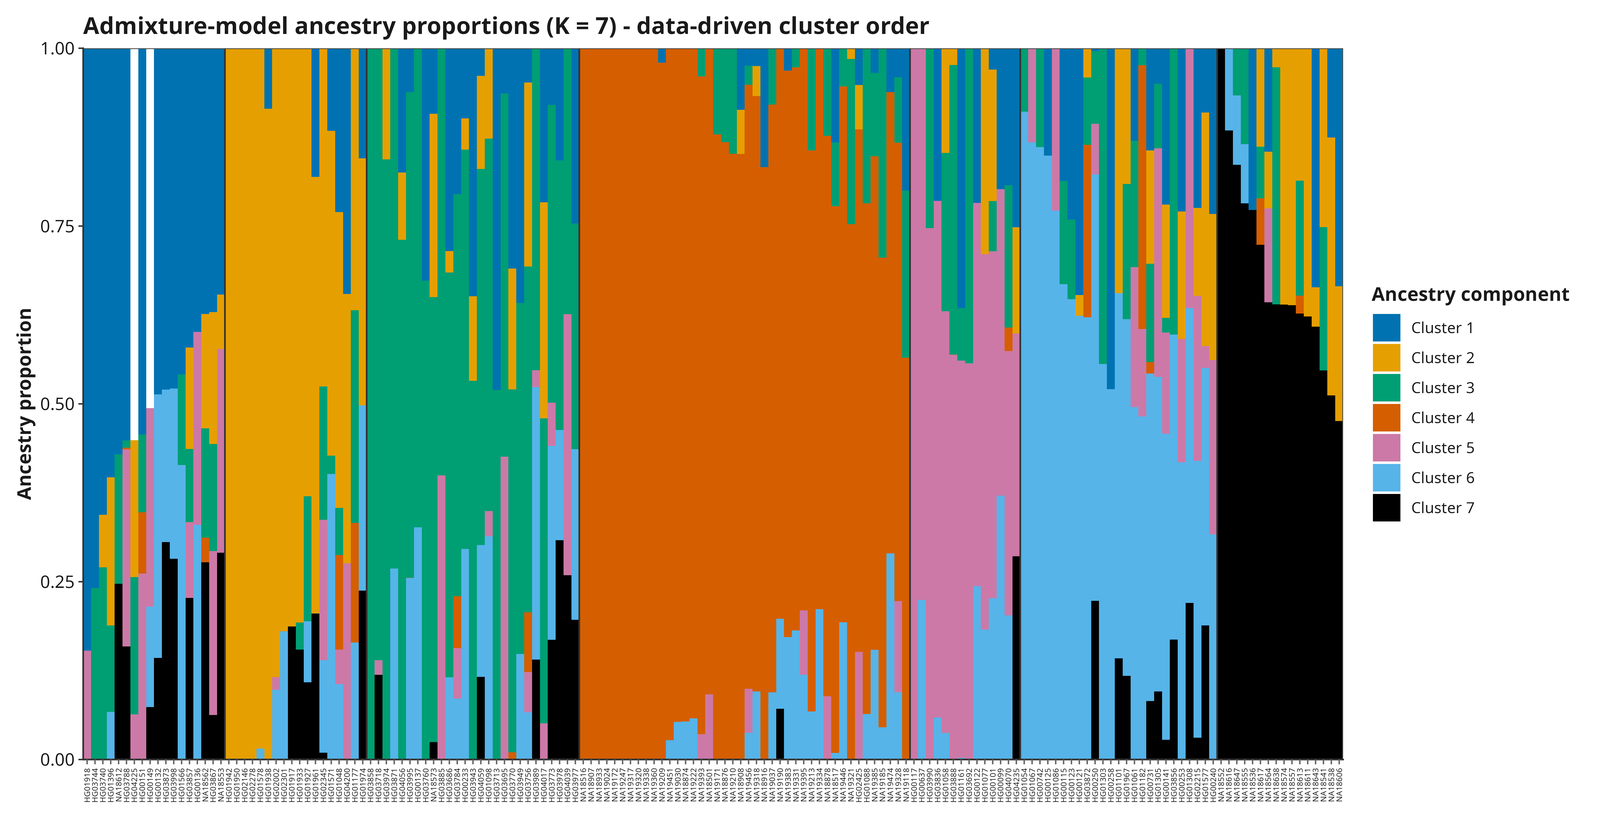
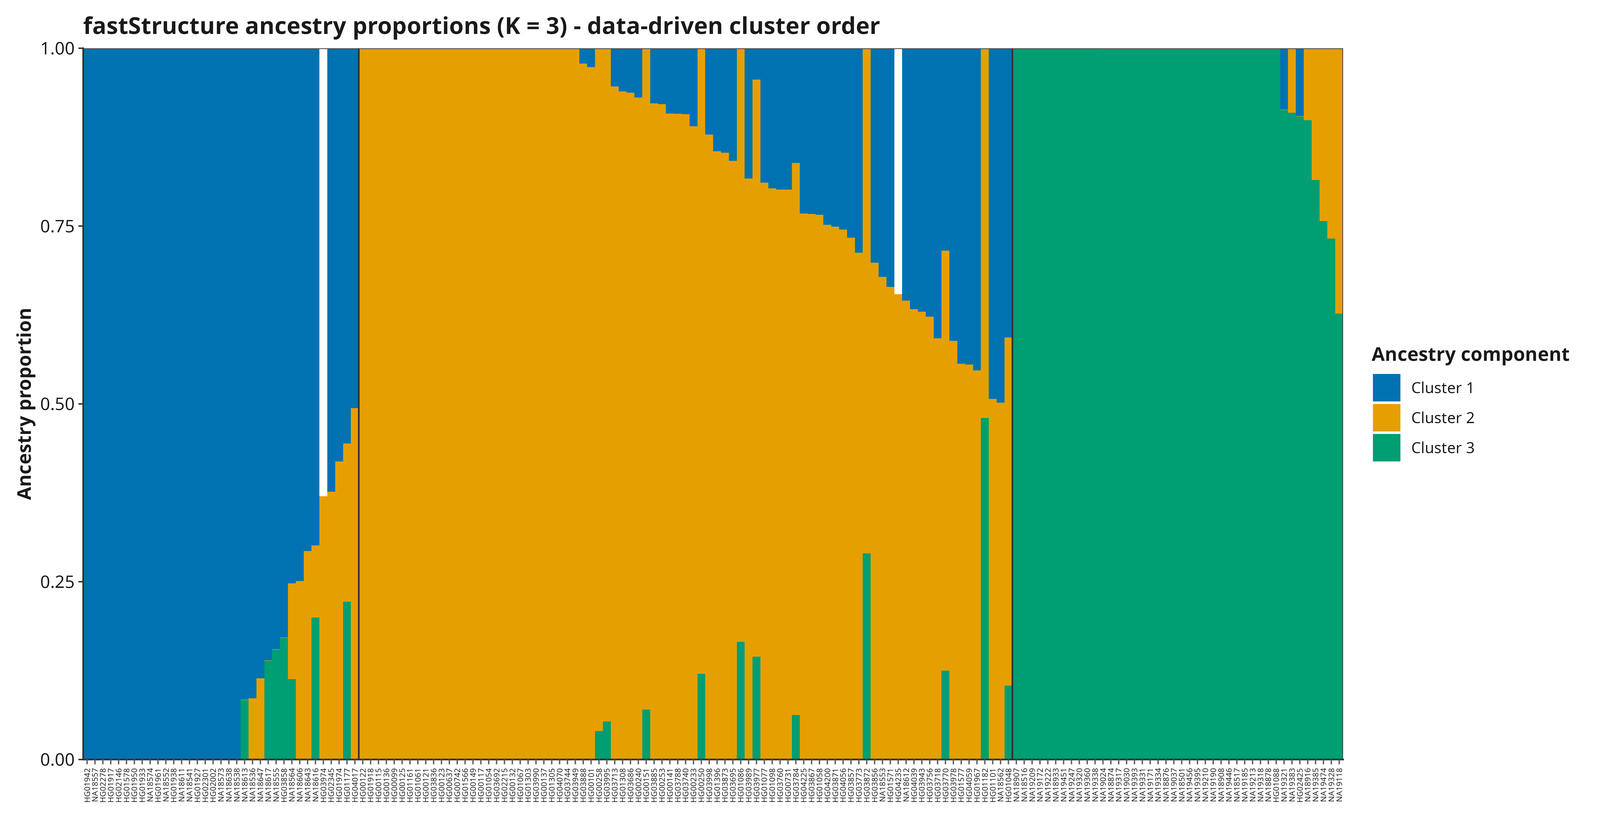
For each K, compare the population-organized membership figure with
the _data_driven_ figure. Both display the same fitted
coefficients. The latter ignores the metadata population labels, groups
samples by their dominant inferred cluster, and orders them by
membership strength. This makes structure that conflicts with the prior
population definitions easier to see without mistaking a different
sample order for a second model fit. Vertical separator lines mark
boundaries between dominant inferred-cluster groups.
The consensus cluster number combines the raw optimum, elbow, and parsimonious plateau or one-standard-error choices from diagnostics that the fitted models already produced. Review the method-level votes, normalized diagnostic panels, agreement fraction, and documented tie-break rather than reporting only the final number. Consensus among related diagnostics is not independent evidence that the selected number represents biological truth. Interpret replicate alignment, convergence, fit metrics, cross-validation or entropy criteria, cluster stability, sample uncertainty, and agreement across backends. Prefer stable patterns supported across replicates and neighboring K values. Do not equate a colour component with a named historical population without independent evidence.
The figures below are from real ADMIXTURE, fastStructure, and sNMF runs against the quickstart example (K=2..9 each, ADMIXTURE with 5-fold cross-validation and sNMF with 5 repetitions per K) – deliberately enabled just for this documentation, not part of the bundled dataset’s default analysis. All three are run independently here, not cross-validated against each other (a separate, heavier release-gate evidence process); their three different consensus K values below (7, 3, 6) are a real, expected illustration of why this section says to distinguish computational agreement from biological truth rather than average or otherwise reconcile them by default.
In every population-organized membership figure below, populations are ordered by similarity of their mean ancestry composition (average-linkage clustering on each population’s per-cluster mean proportions), not alphabetically, so similar populations sit next to each other rather than being scattered apart by name.
ADMIXTURE
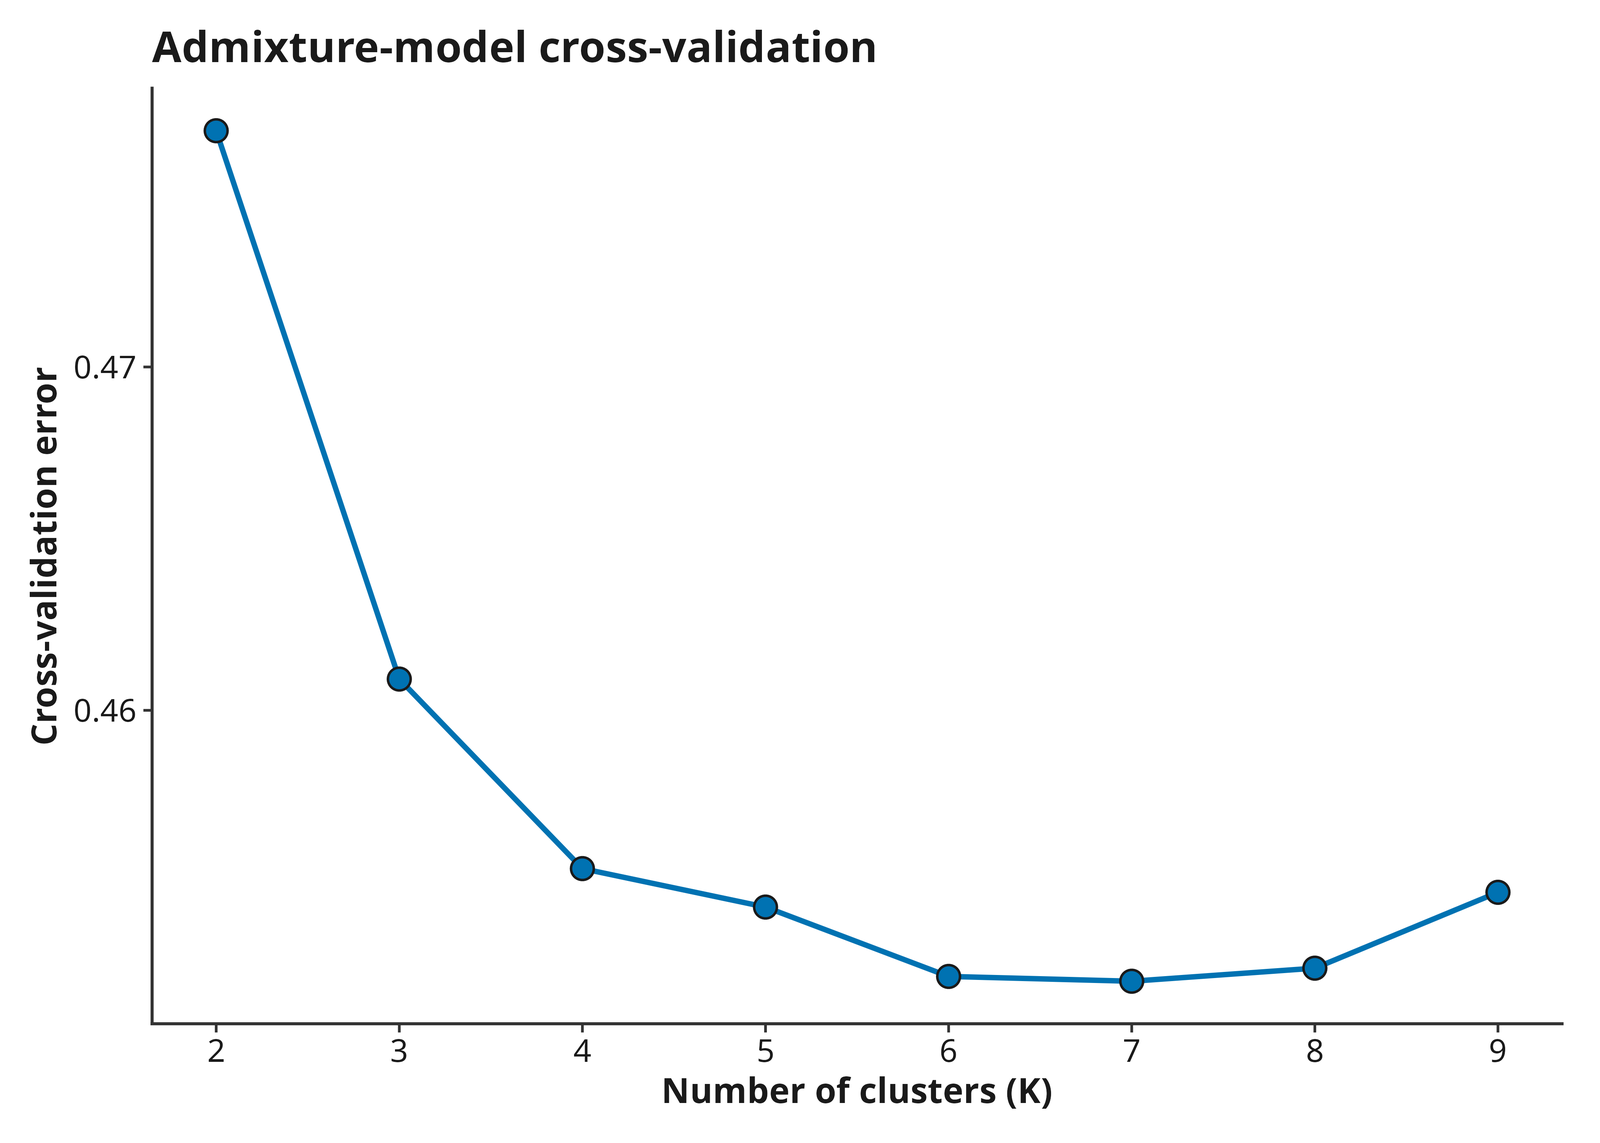
ADMIXTURE’s own native cross-validation error curve above is one of the raw diagnostics the consensus figure below combines with others (the raw cross-validation-error optimum, its elbow, and the parsimonious plateau / one-standard-error choice); showing it directly lets a reader judge how sharp or flat the minimum really is before trusting a single derived number.
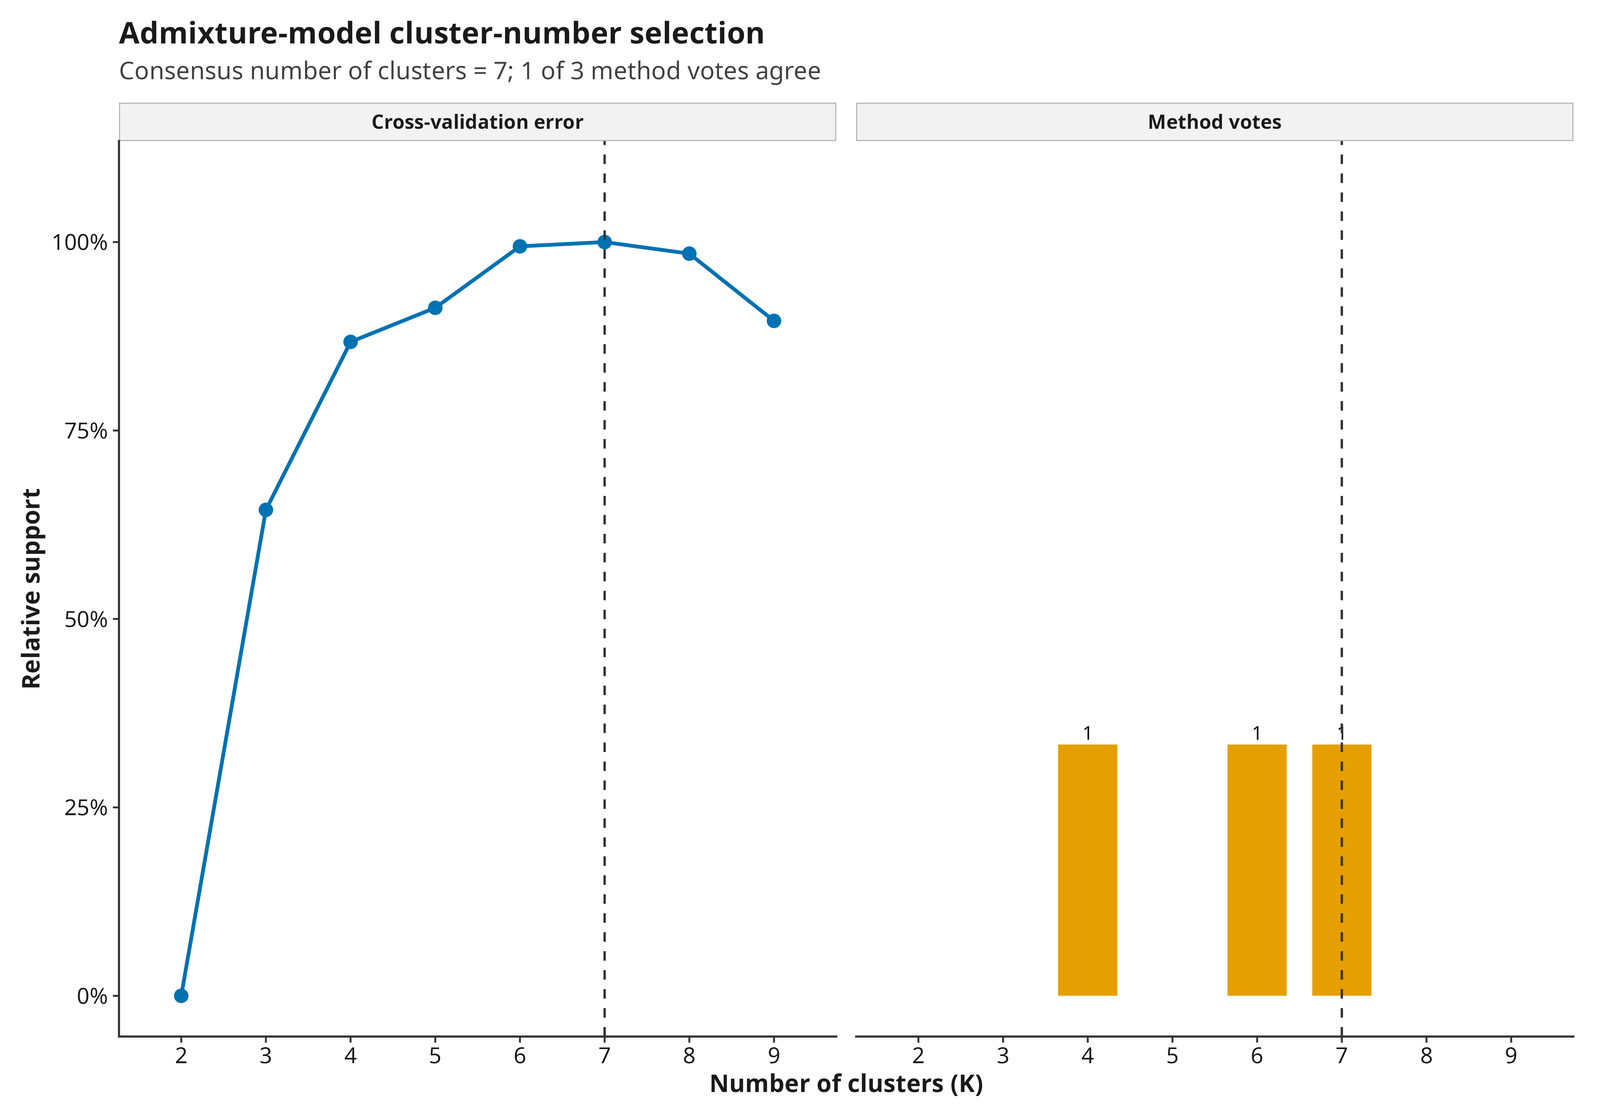
Cross-validation error is lowest and flattens from K=6 through K=9;
the automatic consensus selects K=7. The full report
(27_ADMIXTURE_CV.tsv,
28_ADMIXTURE_Q_K<k>.tsv, and figures) contains a
complete Q matrix and pair of figures for every
requested K, not only the one shown here.
fastStructure
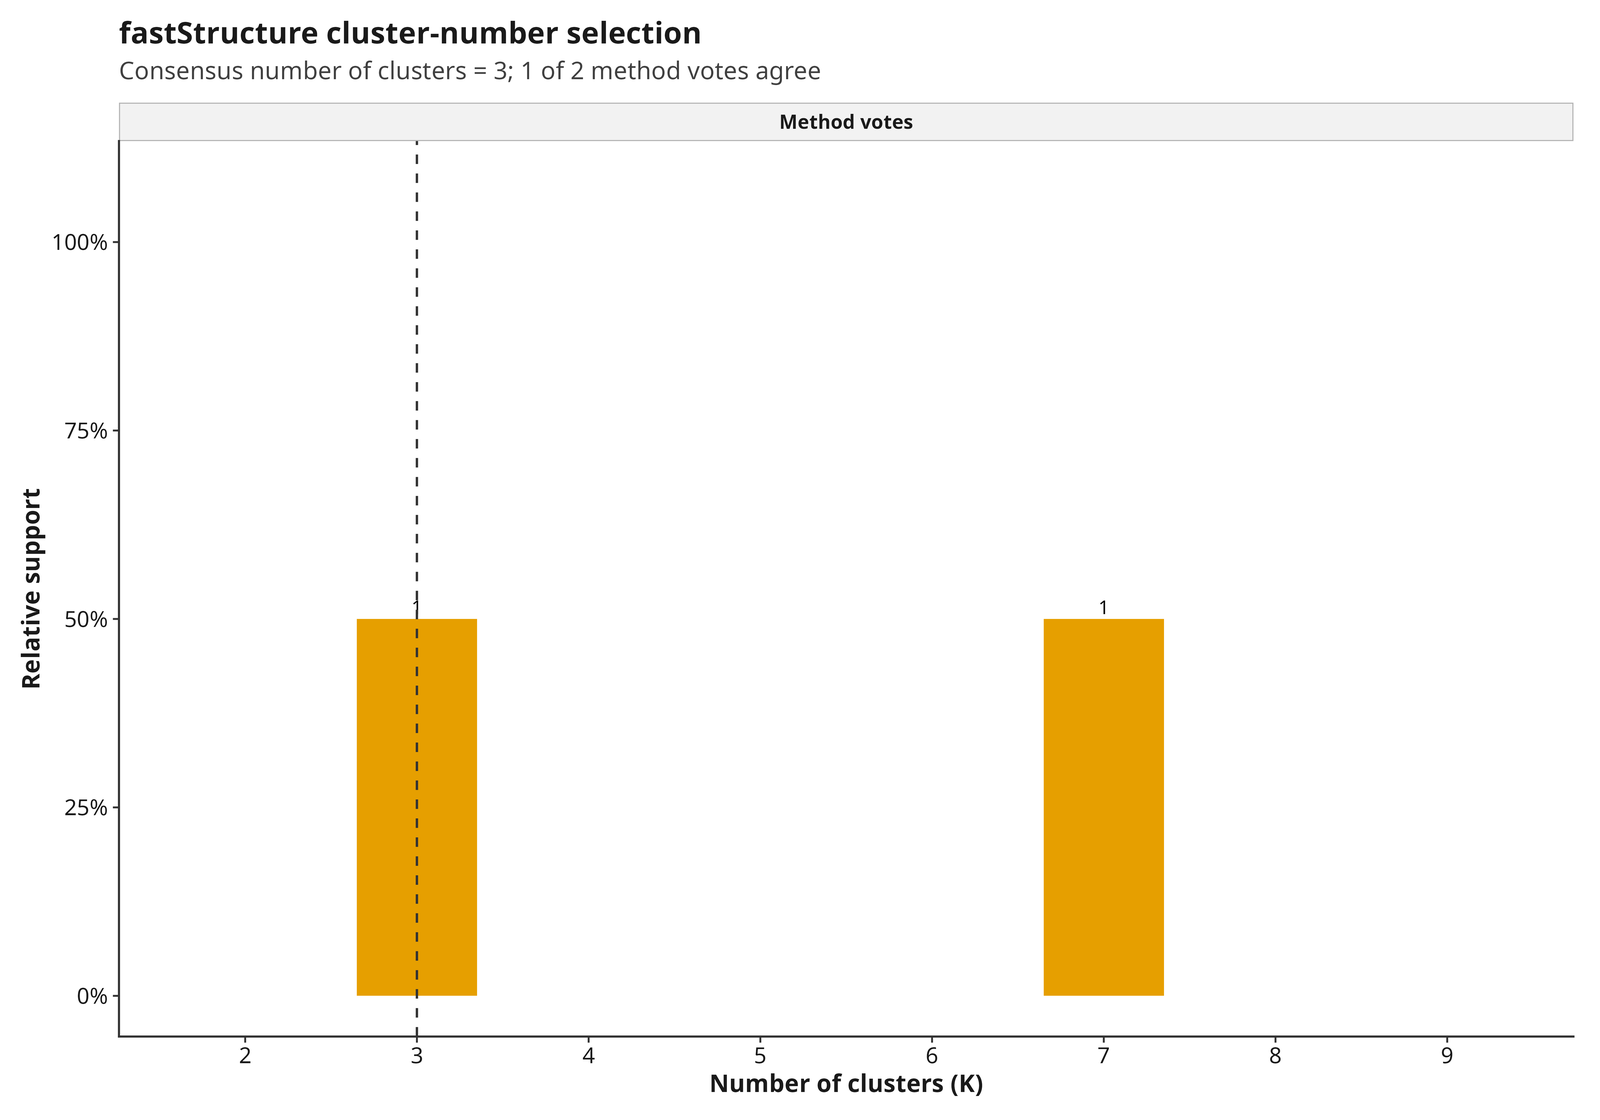
Marginal likelihood peaks at K=3 (-0.849, versus -0.854 to -0.872
elsewhere in the K=2..9 range); the automatic consensus selects
K=3. The full report
(29_fastStructure_runs.tsv,
29_fastStructure_Q_K<k>.tsv, and figures) contains a
complete Q matrix and pair of figures for every
requested K, not only the one shown here.
sNMF
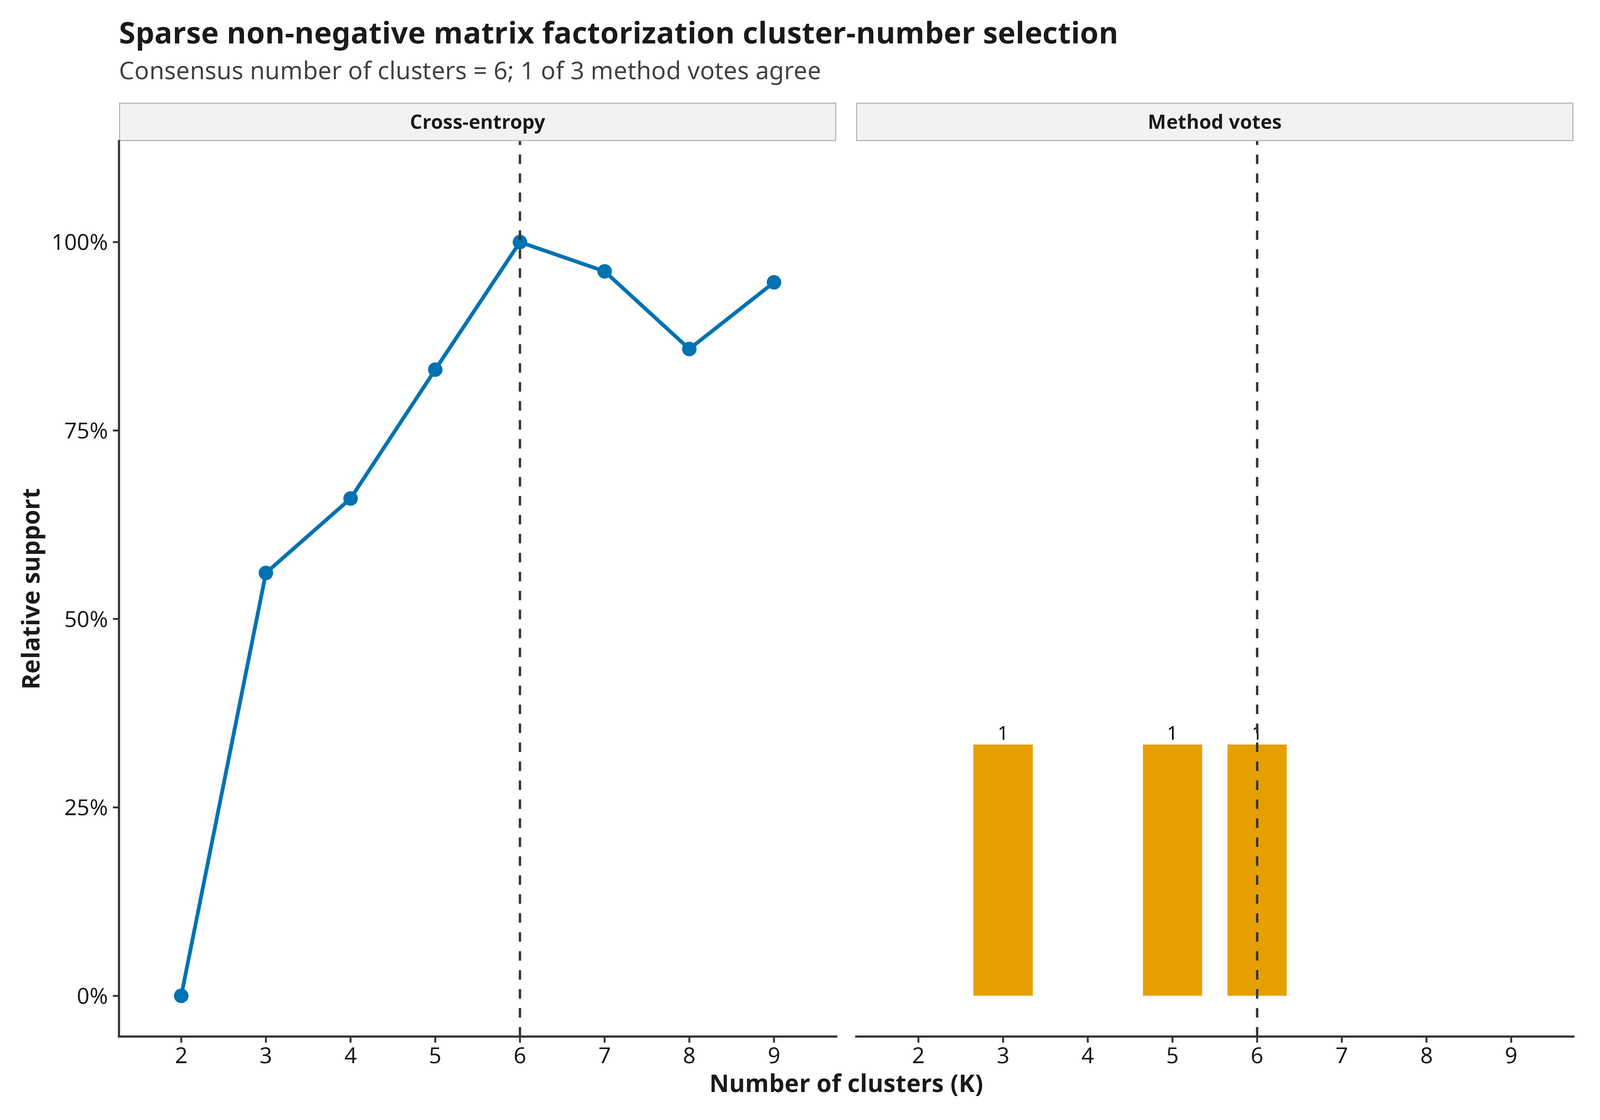
Mean cross-entropy across replicates is lowest at K=6 (0.627, versus
0.628 to 0.650 elsewhere in the K=2..9 range); the automatic consensus
selects K=6. The full report
(30_sNMF_cross_entropy.tsv,
30_sNMF_Q_K<k>.tsv, and figures) contains a complete
Q matrix and pair of figures for every requested K, not
only the one shown here.
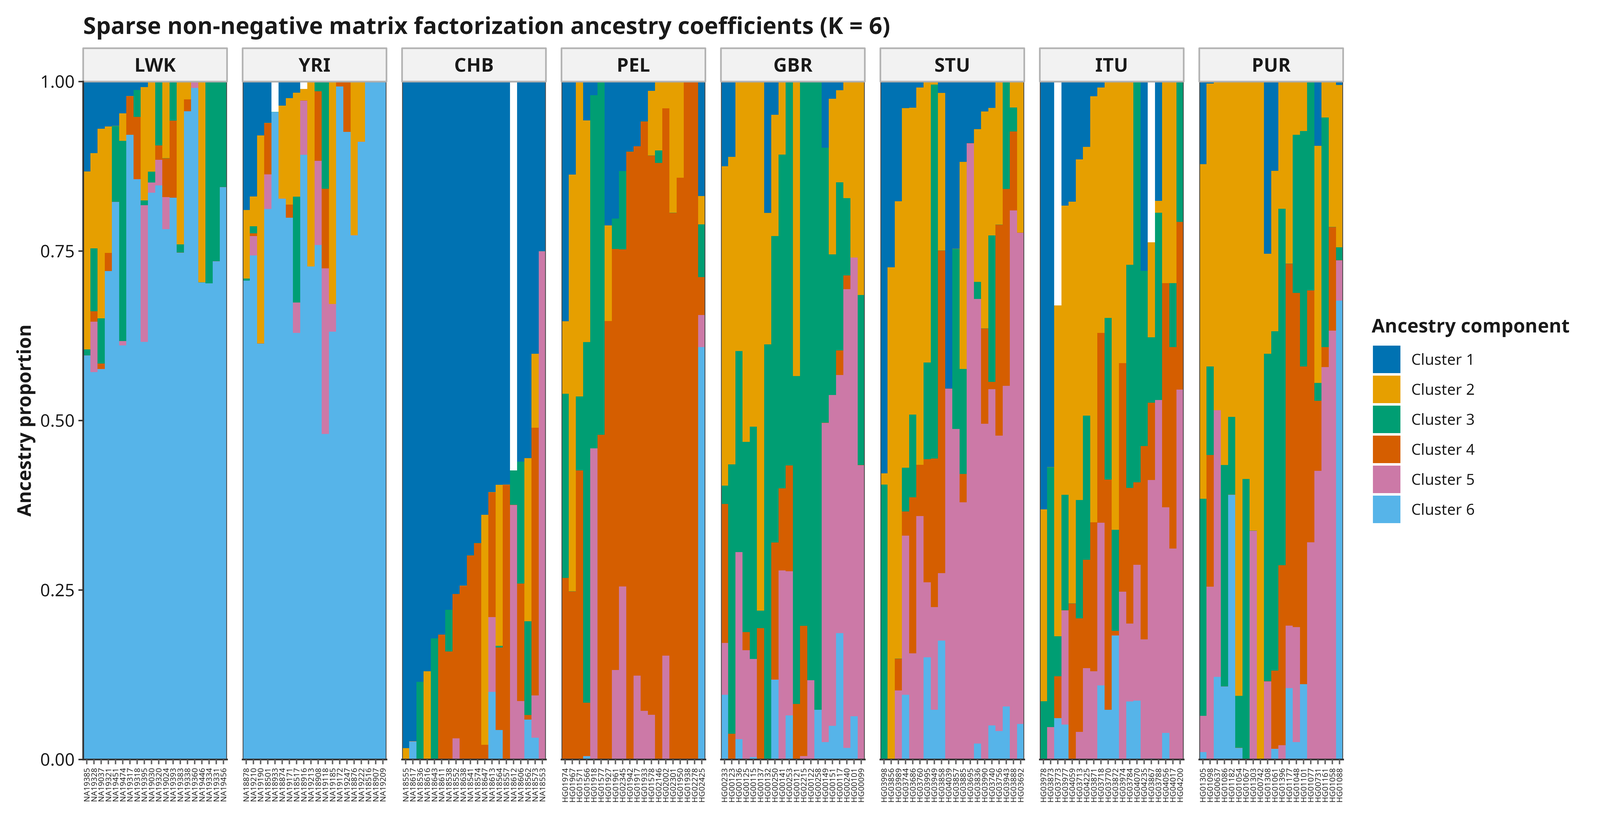
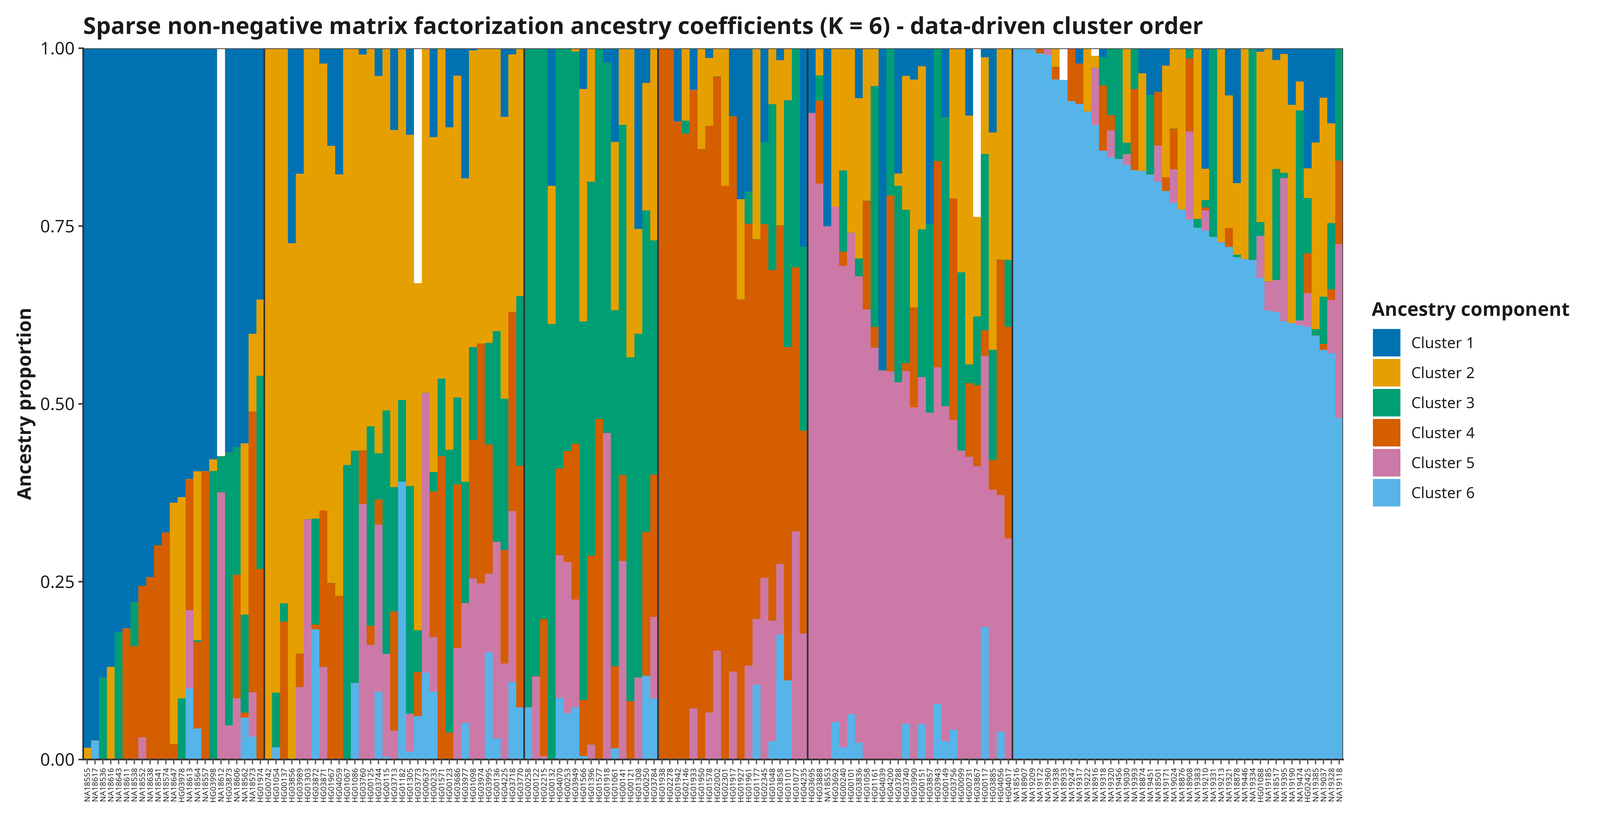
Comparing the population-organized and data-driven figures within each backend above is the standard check described earlier in this section: structure that persists regardless of sample ordering is more trustworthy than structure only visible when samples are pre-sorted by their metadata population label.
Isolation by distance and Mantel analyses
A relationship between genetic and geographic distance can reflect dispersal limitation, barriers, hierarchical structure, sampling geometry, or environmental covariation.
Inspect the distance definitions, complete coordinate pairs, spatial extent, outliers, permutation design, and residual pattern. A Mantel result does not establish a causal spatial process and can be misleading under complex spatial or hierarchical sampling.
The quickstart metadata includes real, documented population-level
collection coordinates (see the dataset’s README.md for the
exact source and the GBR/ITU/STU shared-point caveat), so this module
actually runs for the quickstart example rather than being skipped for
lack of coordinates.
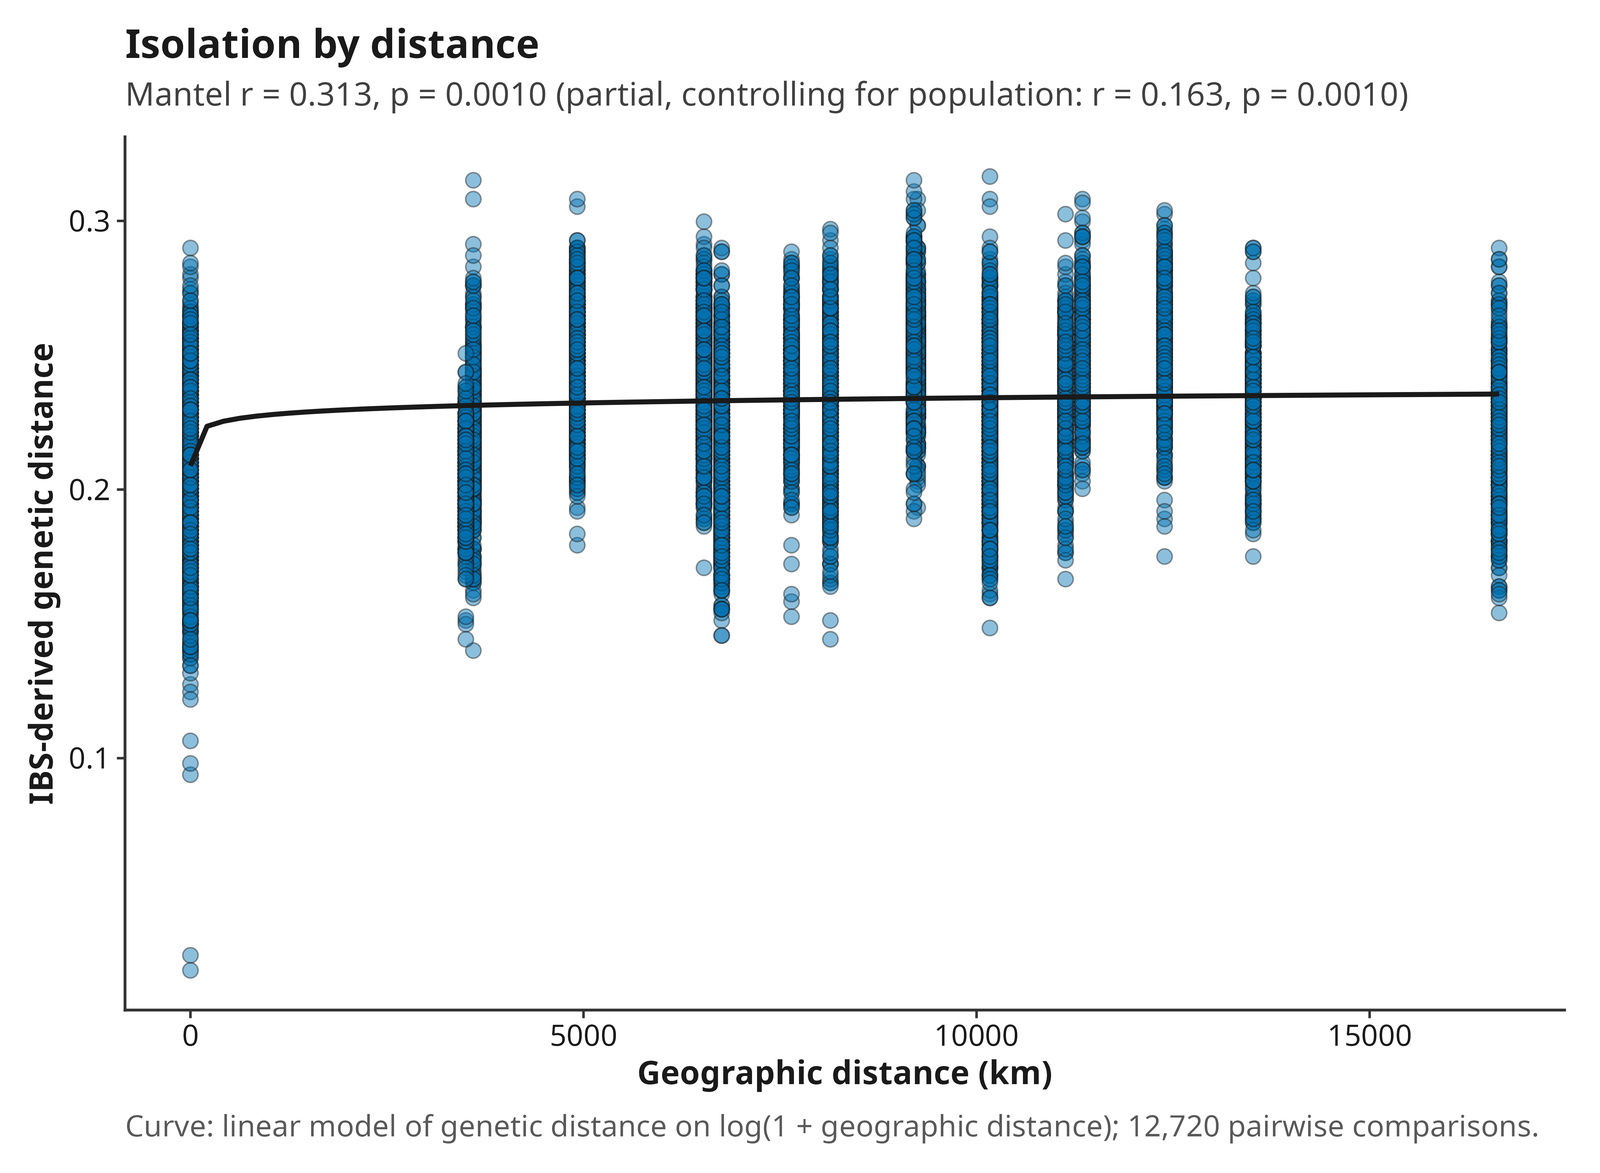
The Mantel test (Pearson, 999 permutations) on the quickstart example gives r = 0.3129, p = 0.001 (the 999-permutation floor), with a positive slope (0.00275, R² = 0.137) across all 12,720 complete sample pairs. The same 8 populations are also the units compared by FST and PCA elsewhere in this report, so this is not independent confirmation from an unrelated experiment.
When population metadata is present with at least two populations, a
partial Mantel test
(vegan::mantel.partial(), Smouse, Long, and Sokal 1986)
also runs automatically, controlling the genetic-vs-geographic distance
correlation for a same/different population indicator – does the
isolation-by-distance signal survive once population membership is
accounted for, or is it purely an artifact of population clustering? On
the quickstart example the partial Mantel r drops to 0.1627 (p = 0.001):
weaker than the plain Mantel r, but still real and statistically
significant, indicating geographic distance carries genuine explanatory
power beyond simple population clustering. Both results are reported
together in the figure’s subtitle above.
Spatial autocorrelation
50_spatial_autocorrelation.tsv bins sample pairs into
geographic-distance classes and reports a spatial-autocorrelation
coefficient r per class (Smouse and Peakall 1999), with a
permutation-based 95% null envelope and p-value – a distance-resolved
complement to the single overall Mantel r above.
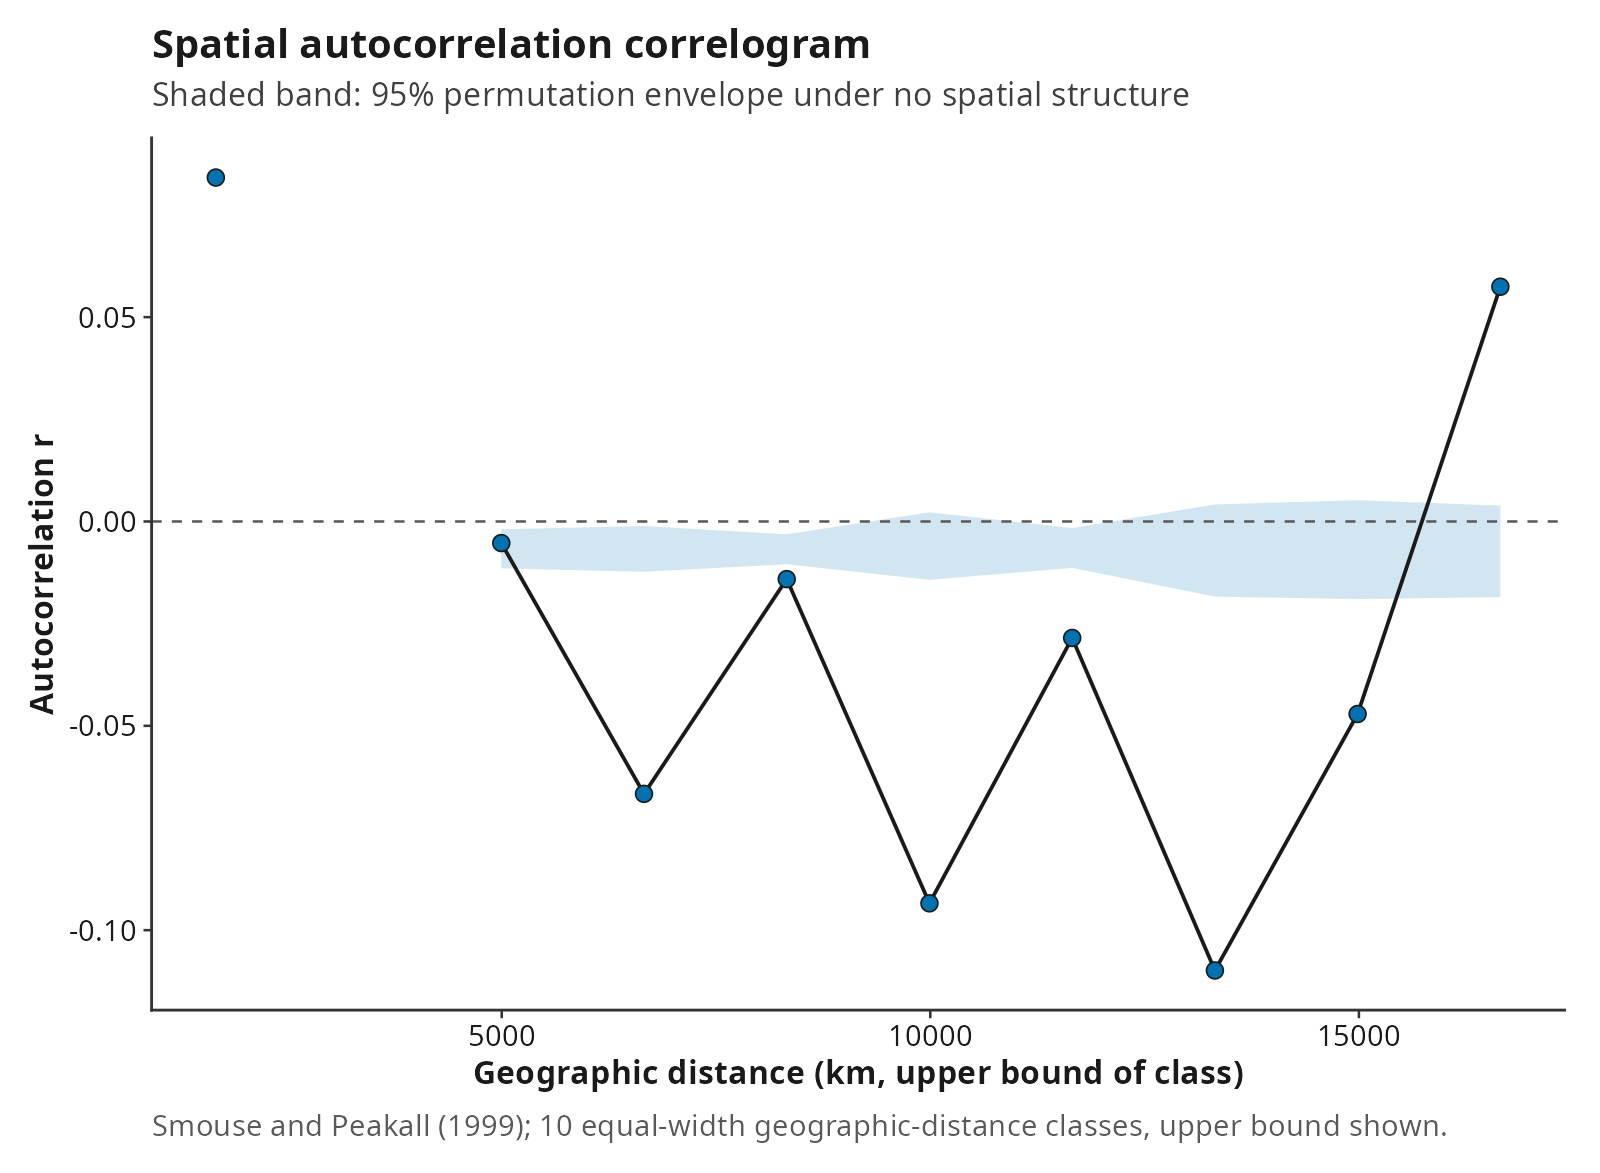
Read this one with real caution: the quickstart metadata uses population-level representative coordinates, not per-individual GPS, so 21% of sample pairs sit at exactly zero geographic distance and the smallest nonzero distance jumps to 3,503 km. Those 2,720 co-located pairs form the first distance class (which includes distance 0) and show the expected positive autocorrelation (r = 0.084, p = 0.001); the second class is empty and every later class compares different collection sites. The correlogram contrasts “same site” with “different sites” here rather than resolving fine-grained within-population spatial structure. Permutation p-values use the (b + 1)/(m + 1) convention, so with the default 999 permutations the smallest reportable value is 0.001, never 0 – treat the quickstart values as a demonstration that the analysis runs correctly, not as a spatial-structure finding.
Integrating analyses
Concordant analyses can strengthen a description, but shared inputs also create shared biases. PCA separation, high pairwise FST, ancestry components, and geographic clustering are not four independent experiments when they use the same samples and variants.
When analyses disagree, investigate sample size, missingness, LD, relatives, population labels, spatial scale, model assumptions, and uncertainty before choosing the preferred narrative.
Reporting checklist
A defensible results section should identify:
- input datasets and checksums;
- sample and variant exclusions;
- filtering and LD-pruning parameters;
- estimator and software versions;
- random seeds, threads, and replicate counts;
- validation state and failed or skipped modules;
- uncertainty intervals or resampling where available;
- limitations and plausible alternative explanations;
- the exact source tables behind each figure.
Scientific conclusions remain the responsibility of the analyst. popgenVCF provides deterministic calculations, evidence records, and transparent failure states; it does not replace study-design review or domain expertise.